Portugal 2017 Fires Prediction / Danger Index prediction on 2010 to 2017 year Remote Sensing Data
Process
Download remote sensing data from NASA and Copernicus
Portugal June and October 2017 Fires as Area of Interest, Product and Date Range to download the HDF files
Products: MOD11A2 & MOD09A1
Pre-processing the data where we convert the HDF to GeoTIFF files.
The files are stitched together and then converted to GeoTIFF
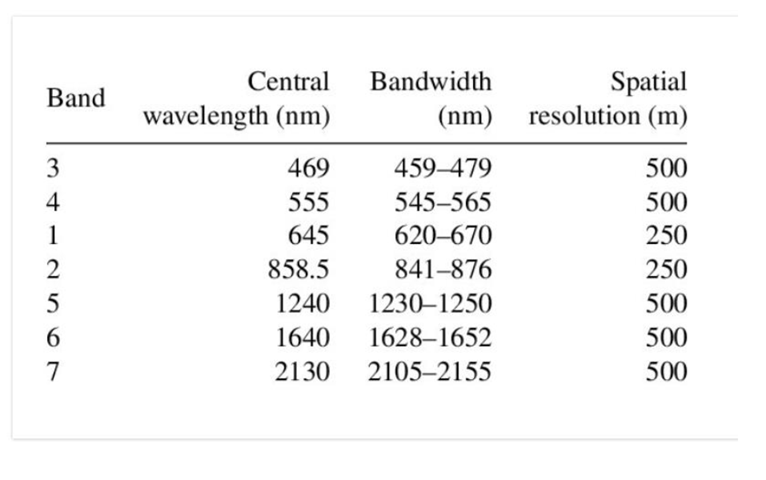
For surface reflectance create a file for every band
Using Raster Calculator recalculate and then do the clipping process using Portugal Shape files.
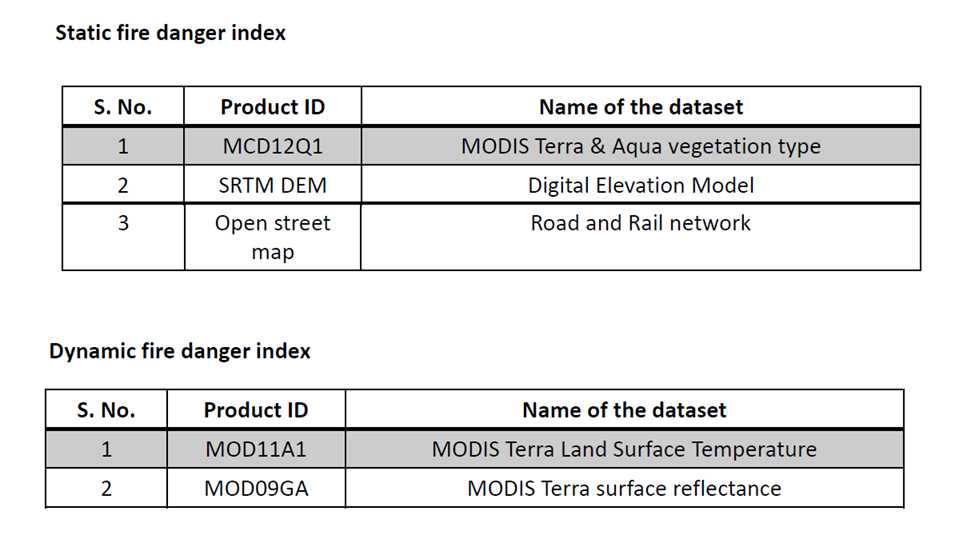
Datasets
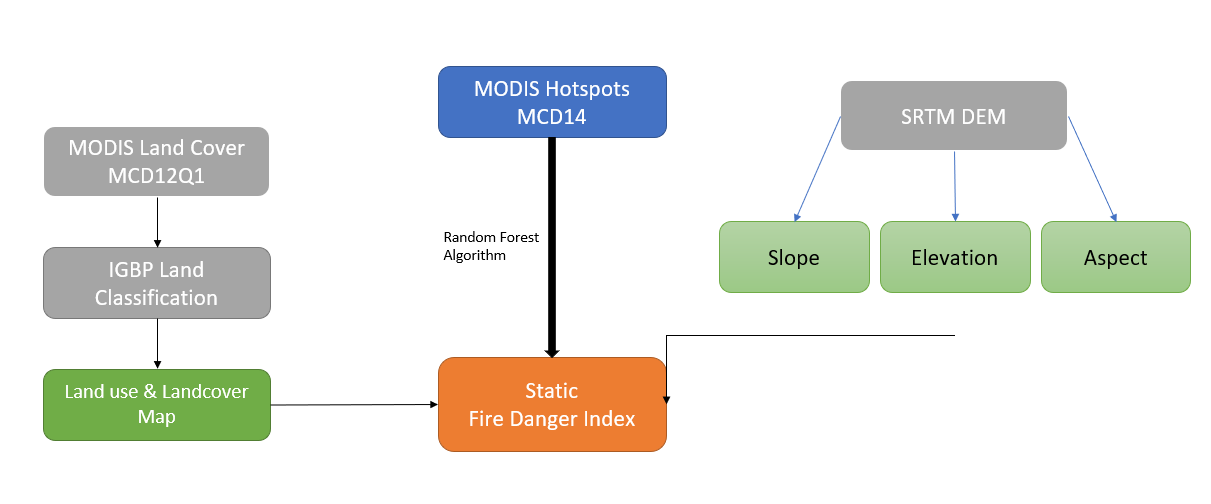
MCD12Q1 V6 Data
The MCD12Q1 V6 product provides global land cover types at yearly intervals (2001-2016) derived from six different classification schemes. It is derived using supervised classifications of MODIS Terra and Aqua reflectance data. The supervised classifications then undergo additional post-processing that incorporate prior knowledge and ancillary information to further refine specific classes.
LC_Type1 Band: Land Cover Type 1: Annual International Geosphere-Biosphere Program (IGBP) classification
SRTM & ASTER GDEM
The Shuttle Radar Topography Mission (SRTM) obtains digital elevation models on a near-global scale to generate the most complete high-resolution digital topographic database of Earth prior to the release of the ASTER GDEM in 2009. It had interferometric synthetic aperture radar.
Digital Elevation Model data access from USGS
MOD11A2
The MOD11A2 Version 6 product provides an average 8-day per-pixel Land Surface Temperature and Emissivity (LST&E) with a 1 kilometer (km) spatial resolution in a 1,200 by 1,200 km grid.
The MOD11A2 V6.1 product provides an average 8-day land surface temperature (LST) in a 1200 x 1200 kilometer grid. Each pixel value in MOD11A2 is a simple average of all the corresponding MOD11A1 LST pixels collected within that 8 day period. The 8 day compositing period was chosen because twice that period is the exact ground track repeat period of the Terra and Aqua platforms. In this product, along with both the day- and night-time surface temperature bands and their quality indicator (QC) layers, are also MODIS bands 31 and 32 and eight observation layers.
Band: LST_Day_1km
MOD09GA
Surface reflectance improves comparison between multiple images over the same region by accounting for atmospheric effects such as aerosol scattering and thin clouds, which can help in the detection and characterization of Earth surface change.
The MOD09GA Version 6 product provides an estimate of the surface spectral reflectance of Terra Moderate Resolution Imaging Spectroradiometer (MODIS) Bands 1 through 7
The MODIS Surface Reflectance products provide an estimate of the surface spectral reflectance as it would be measured at ground level in the absence of atmospheric scattering or absorption. Low-level data are corrected for atmospheric gases and aerosols. MOD09GA version 6.1 provides bands 1-7 in a daily gridded L2G product in the sinusoidal projection, including 500m reflectance values and 1km observation and geolocation statistics.
MODIS Hotspots MCD14
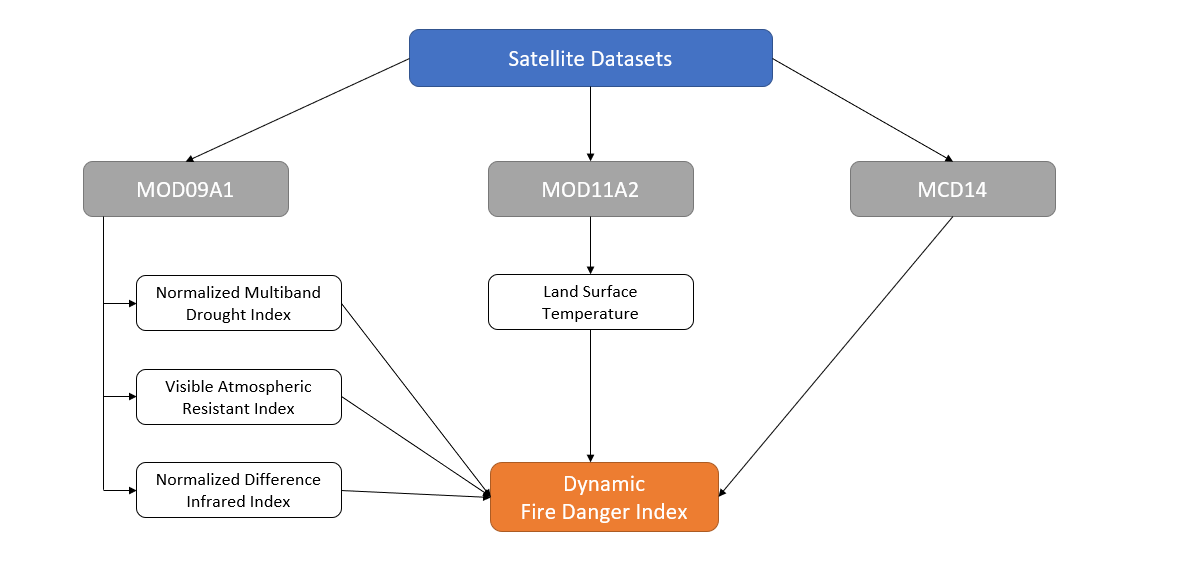
Dynamic Index
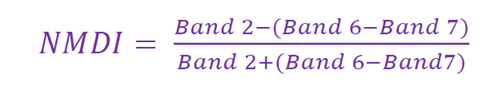
NMDI
The Normalized Multi-band Drought Index (NMDI) has been used as a proxy for drought
The NMDI was proposed by Wang and Qu in 2007 to estimate the amount of water content present in soil and vegetation (Wang & Qu, 2007)
Visible Atmospheric Resistant Index (VARI)
VARI is a greenness index
VARI is minimally sensitive to atmospheric effects and was developed for estimating green vegetation fraction, which is precisely the purpose of using relative greenness (Gittleson et al. in 2002)
VARI is calculated from the MODIS bands of 1 3 and 4 of MOD 09 GA datasets
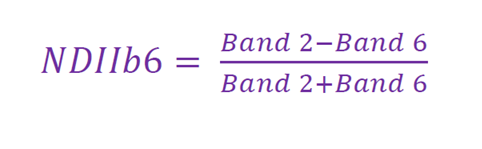
Normalized Difference Infrared Index (NDII) – B6
Normalized Difference Infrared Index Band 6 was used to measure the dry fuel connectivity
NDIIb6 is highly correlated with canopy water content, which is one the most important fire affecting vegetation characteristics, since moisture constrains flammability
Random Forest Algorithm
Random Forest is a powerful and versatile supervised machine learning algorithmthat grows and combines multiple decision trees to create a “forest.” It can be used for both classification and regression problems in R and Python.
Random Forest grows multiple decision trees which are merged together for a more accurate prediction.
The logic behind the Random Forest model is that multiple uncorrelated models (the individual decision trees) perform much better as a group than they do alone. When using Random Forest for classification, each tree gives a classification or a “vote.” The forest chooses the classification with the majority of the “votes.” When using Random Forest for regression, the forest picks the average of the outputs of all trees.
Random Forest (RF) Machine Learning Algorithm is being used; it is capable to handling large dataset and also enhances accuracy of the model. RF can select important variable and evaluate complex interaction between variables.
Random forests are created from subsets of data and the final output is based on average or majority ranking and hence the problem of overfitting is taken care of. Random forest randomly selects observations, builds a decision tree and the average result is taken.
We are processing datasets from 2010 to 2016 for Fire Presence points and generated fire absence points
Fire occurrence probability maps are generated by using Kriging Interpolation Method.
Kriging weights the surrounding measured values to derive a prediction for an unmeasured location.
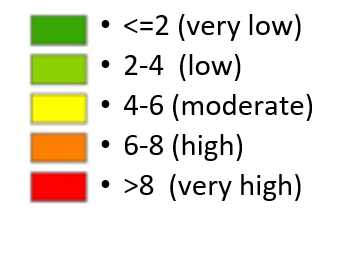
Wildfire Danger Index
The Wildfire danger index is an integration of the static fire danger index and the dynamic fire danger index.