No one can predict fire ignition – but we can predict area at risk of wildfire, we can predict and prevent megawildfires and we can mitigate the risk and loss from wildfires.
In a ground breaking report, ForestSAT.Space has relied on satellite data from 8 Earth Observation satellites dating back a decade to analyse the grasslands, farmlands, hills and wildlands in Limassol. The systemic analysis using GIS science and methodologies we watched how the risk factors grew and then multiplied to make a massive fire imminent ahead of the summer season of 2025.
Our wildfire risk mapping and forest fire prediction models designed to take risk-mitigation action ahead of the fire reason were stacked over the actual fire burned area of 2025 fires it showed an eery result. Nearly all burned area was mapped as “high risk” through decade of analysis.
July 2020 Limassol Fire: A tragedy that shattered Cyprus
In July 2025, Limassol was struck by a devastating wildfire that would forever change the lives of its residents and the beauty of its landscape. As flames engulfed vast stretches of land, the heart of the community was shattered. Families watched in horror as their homes were reduced to ash, their lifelong memories disappearing in an instant. The once vibrant forests, teeming with wildlife, were left charred and lifeless, silencing the songs of birds and the rustling of leaves.
The impact of this tragedy extended beyond physical destruction; it tore at the very fabric of the community. Neighbours united in the face of despair, offering support and solace to one another amid the chaos. The loss weighed heavily on everyone’s hearts, as the beauty of nature that had sustained and inspired them was reduced to smoke and embers. As we reflect on that fateful day, we feel a deep sense of sorrow not only for the lives affected but also for the irreplaceable loss of our environment. The scars left by that wildfire serve as a painful reminder of the fragility of our world and the resilience of the human spirit. Together, we strive to rebuild, to heal, and to honour those losses by fostering a renewed commitment to protecting our cherished landscapes.


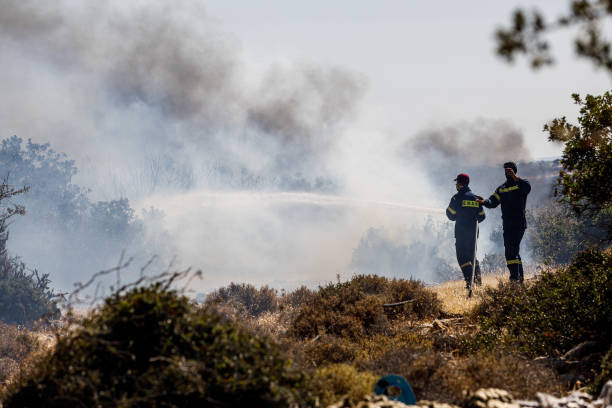
A resident hurls a bucket of water into the charred shell of a home.
Let’s examine the damage caused by the wildfire in 2025. We will see the conditions a city experienced during a megawildfire and the extent of the damage it created. Now, let’s discuss the numbers.
Table 1:-Limassol wildfire 2025 losses.
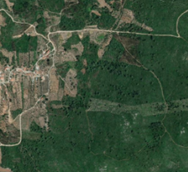
The table (1) clearly illustrates the extent of the devastation in Limassol. A vast area of about 125 square kilometres was burned across the hills and wine villages, turning once-green slopes into ash. Tragically, two people lost their lives, and many others required treatment for burns and smoke inhalation as evacuations took place in several communities. Approximately 700 buildings and structures were damaged or destroyed, resulting in hundreds of families losing their homes, belongings, and the everyday items that contribute to a stable life.
Agricultural losses were significant, with vineyards, fields, and orchards suffering extensive damage. This destruction not only wiped out this year’s harvest but also raised concerns about next year’s yields, as it takes time for vines and trees to recover.


Livestock perished, wildlife lost their habitats, and the countryside will require several seasons to heal. Monetarily, the damage to buildings alone runs into tens of millions of euros, and the overall cost is much higher when considering the ruined crops, lost equipment, and environmental damage. All of this occurred during extremely hot, dry, and windy days—conditions that allowed a small spark to escalate into a rapid and terrifying fire. The figures in the table represent more than just statistics; they capture the community’s shock, the farmers’ uncertainty, and the long road to recovery that now lies ahead.
Now the question is: Is it predictable? Was Limassol Fire Predictable?
We can confidently say yes to predicting megafires. While it’s true that we cannot predict all wildfires due to their various natural and human-related causes, we can forecast megafires more effectively. We cannot predict – no one can – when someone might ignite a wildfire. Arson remains a major cause of wildfires. Sometimes accidents and nature too start wildfires but over 80% wildfires are started by humans. While we cannot predict who might start a fire, where and when we can predict which areas are at a risk of burning ferociously because we can measure the fuel on the ground the conditions that can run a fire into a megawilddfire.
There are numerous sources for satellite data, and by utilising Geographic Information Systems (GIS) and remote sensing technologies, we can analyse this data to make predictions regarding megafires.
We began our study by examining the factors that contribute to wildfires, which include human interaction, climate change, vegetation health, and the topography of the area. In particular, we focused on the causes of the Limassol wildfire, which are:
– Vegetation health
– Dense vegetation
– Plant moisture
– Burn damage
– Ground heat
– Rainfall
To validate the significance of these parameters, we compared them with nine different locations around the world where major wildfires have occurred. This analysis allowed us to confirm that these factors play a crucial role in the development of wildfires, potentially escalating them into megafires.
After monitoring these parameters in those nine locations, we concluded their impact on wildfires. We then applied the same methodology to assess the situation in Limassol, enabling us to predict the risk of a megafire occurring there in 2025.
Now, let’s see how we predict the Limassol wildfire 2025.
Table of Contents
| SERIAL NUMBER | TOPIC | PAGE NUMBER |
| 1 | Introduction | |
| 2 | Study Area | |
| 3 | Literature Review | |
| 4 | Aim and objective | |
| 5 | Data sets | |
| 6 | Platforms | |
| 7 | Methodology | |
| 8 | Result and discussion | |
| 9 | Conclusion | |
| 10 | Limitations |
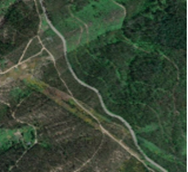
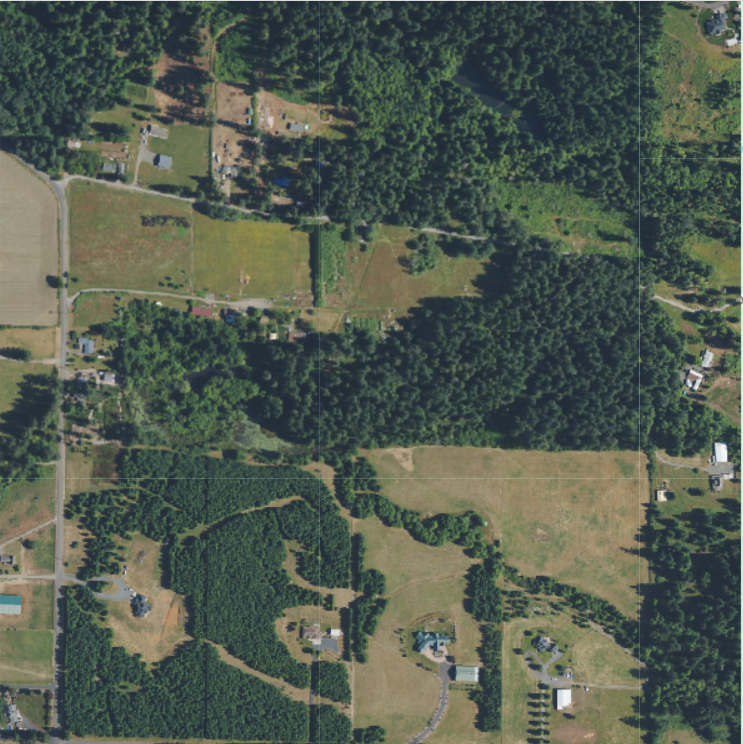
A firestorm that ravaged Limassol
On July 23, 2025, a rapidly spreading wildfire ignited north of Limassol, sweeping through villages, fields, and forested hills throughout the day and night. To understand why it spread so aggressively, it is helpful to consider seven key factors.
First, Vegetation Health: Areas with greener and denser vegetation contain more plant material to burn, similar to stacking extra firewood before a spark even lands.
Second, Dense Vegetation: Tightly packed bushes, vines, and pines allowed flames to quickly reach adjacent plants, enabling the fire to leap ahead without slowing down.
Third, Plant Moisture: After hot days and periods of dryness, leaves and grasses lose moisture and become brittle. Once dried, even small embers can ignite them.
Fourth, damage from previous fires is significant because ash and hidden embers can rekindle, sending sparks into nearby shrubs and triggering new fires.
Fifth, the Slope of the Land accelerates the spread of fire: on steep terrain, heat rises and preheats the plants above, causing fires to climb more rapidly than they would on flat ground.
Sixth, rainfall (or the lack thereof) determines the landscape’s readiness to catch fire; insufficient rain leaves twigs and grasses bone dry, while consistent rain keeps them damp and less likely to ignite.
Seventh, the Ground Temperature during heatwaves heats the soil and plants, making them more susceptible to ignition and harder to extinguish.
Monitoring these seven indicators in real-time is vital. Vegetation Health and Dense Vegetation indicate areas rich in fuel, guiding where trimming, clearing, or patrols should be concentrated. Plant Moisture, rainfall, and ground temperature signal rising risks and inform when to issue alerts or restrict hazardous activities. The slope helps map potential fire paths, allowing crews to position firebreaks and equipment before the flames arrive strategically. Lastly, tracking burn damage helps identify lingering hotspots to prevent them from reigniting.
In summary: greener and denser plants, dried-out leaves, steep hills, dry weather, and intense heat can turn a spark into a fast-moving blaze. Being vigilant about these everyday indicators can save time, property, and lives.
Study area
Limassol (Cyprus)
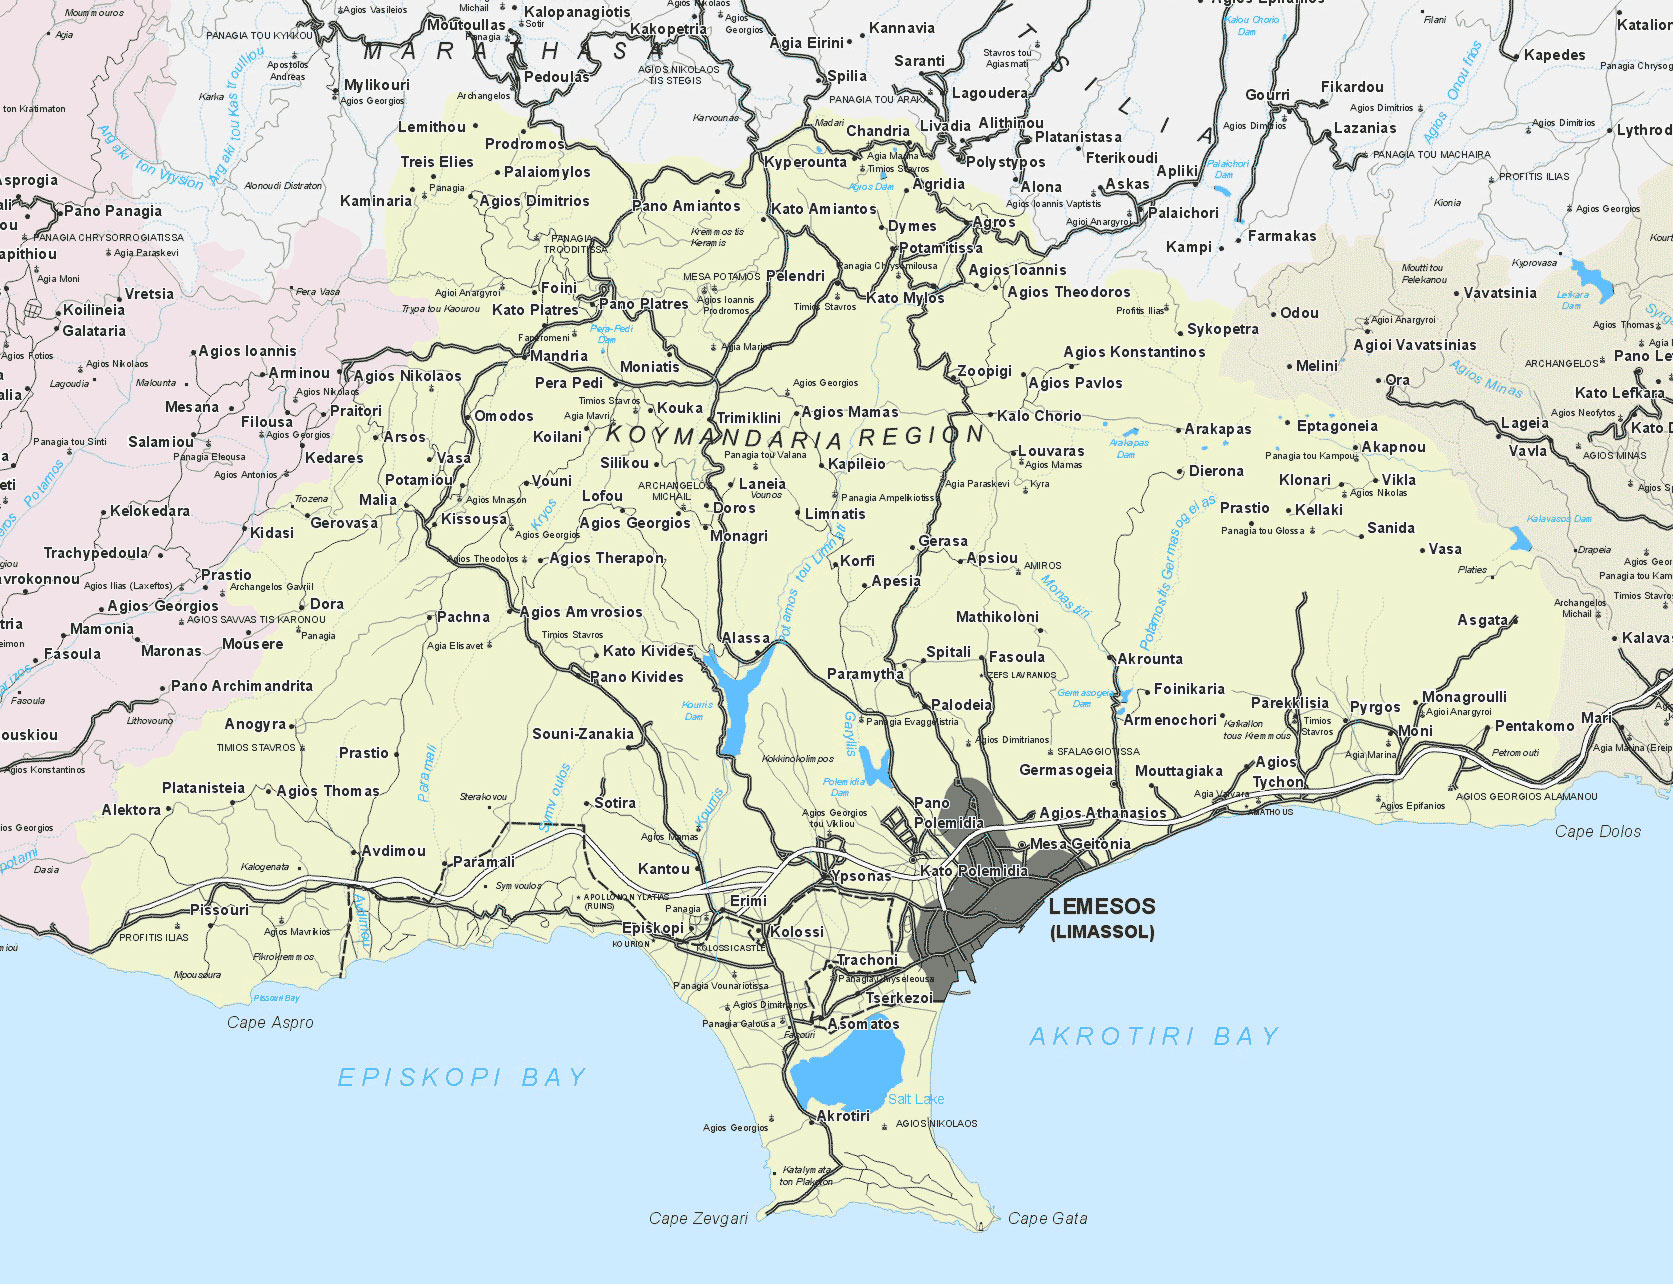
Coordinates: 34.6747° N, 33.0442° E.
Country / District: Cyprus / Limassol.
Municipality area (city): ~35.09 km².
Urban area: ~124.71 km².
District area: 1,393.3 km².
Population (2021): 262,238.
Elevation: Sea level on the coast, rising inland toward the Troodos; the island’s highest peak, Mount Olympus/Chionistra (1,952 m),
Science of Wildfire Prediction and Wildlands monitoring from Earth Observation Satellites
1.1 Remote Sensing in Wildfire Science:
Wildfires are one of the most damaging environmental problems in the world today. They destroy forests, wildlife, and homes, and their frequency has increased due to climate change, human activities, and land-use changes (Kurbanov et al., 2022). Earlier studies on fire risk mainly relied on old records and expert experience. These methods were useful but could not always predict fires under today’s fast-changing weather conditions (Liu & Zhang, 2024).
With the help of satellites, it is now possible to watch how healthy or dry vegetation is across large areas. Satellites like Landsat and Sentinel-2 take regular pictures of the land, helping scientists identify places where the ground is getting too dry, or vegetation is becoming flammable (Jodhani et al., 2024).
They also use temperature data from space to see which areas are heating up faster and may become more likely to catch fire (Rather et al., 2018).
When the sky is cloudy, and normal cameras can’t see through, radar satellites (known as SAR) can still collect information about the land surface. This is especially helpful in mountainous or coastal areas like Cyprus.
Modern platforms like Google Earth Engine (GEE) allow large amounts of satellite data to be processed in a few minutes instead of days, making it possible to prepare real-time maps of fire danger (Jodhani et al., 2024).
1.2 Wildfire Risk Modelling Approaches:
In the past decade, the use of computer-based models has changed how scientists study wildfire risk. These systems use machine learning — a way for computers to learn from past data and identify patterns that humans might miss.
For example, one type of model called Random Forest (RF) studies how different factors like vegetation, slope, and weather interact to increase or decrease fire risk (Barzani et al., 2024). Another approach, called Support Vector Machine (SVM), helps computers focus only on the most important information when predicting where fires might occur (Barzani et al., 2024).
Some newer techniques combine several models together — this is called ensemble modelling — and these often give more accurate results (Abdollahi & Yebra, 2023). Meanwhile, deep learning systems, which use artificial intelligence to “see” images much like humans do, can recognise burned areas or dangerous dry zones even faster (Xi et al., 2024).
All these modern techniques have one goal: to predict danger early enough so that firefighters and planners can act before a fire starts.
1.3 Climate and Terrain Influence on Fire Behaviour:
Fires don’t start or spread randomly. Studies show that they depend on a few key conditions in nature and around human settlements:
· Terrain (land shape): Fires move faster uphill and along steep slopes. South-facing slopes get more sunlight and dry out quicker, increasing fire risk (Gale et al., 2021).
· Vegetation (plants and trees): Dry grass, bushes, and forests act as fuel. Scientists use vegetation indicators from satellites to measure how green or dry an area is (Jodhani et al., 2024).
· Weather: Hot, dry, and windy days are the most dangerous. High temperatures and strong winds make it easier for fires to start and harder to control (Rather et al., 2018).
· Human activity: Fires are often started accidentally near roads, farms, or villages. Activities like open burning, sparks from vehicles, and waste disposal increase the chance of ignition (Puri et al., 2011).
· By studying all these factors together, computer models can highlight the specific places that are most likely to face wildfires in the coming months.
1.4 Research being Done:
Although scientists have made great progress in wildfire prediction, some important challenges remain. Most global studies are done on a large scale, but there are not enough detailed models for small regions like Limassol (Varela et al., 2018).
Many older systems also use low-resolution images that cannot detect changes in small patches of vegetation (Papadopoulos & Koutsias, 2020).
There is also a need for models that use live weather and satellite data — not just old records — so that predictions can be updated daily (Liu & Zhang, 2024).
Finally, even though universities and research centres have built advanced systems, they are often not accessible to the firefighters and local authorities who need them most (EFFIS, 2023).
This study helps close those gaps by combining high-quality satellite data, local knowledge, and computer modelling into a tool that can be used directly for fire prevention in Limassol.
ForestSAT.space Mission – Predict & Prevent MegaWildfires
-
To prevent Megawildfires, at ForestSAT, we do.
-
Mapping of risk classes on the basis of vulnerability of wildfire spread.
-
Mitigations for reducing the effects and damage of wildfires.
Data sets
| Satellite / Dataset | Description |
USGS (Landsat7, 8 & 9)
 |
These are American satellites that take detailed pictures of Earth’s surface every few days. They help track vegetation, water bodies, urban growth, and changes in land over time. |
Copernicus Sentinel-2
 |
European satellites that capture high-quality images of the Earth in colour and infrared. They are useful for studying forests, crops, water, and environmental changes. |
MODIS
 |
A sensor on NASA’s Terra and Aqua satellites that provides daily global images. It helps monitor large-scale changes like wildfires, droughts, and climate patterns. |
FIRMS
 |
A NASA system that shows near-real-time fire locations around the world using data from MODIS and VIIRS satellites. It helps track and manage wildfires. |
OpenStreetMap (OSM)
 |
A free, community-made world map that includes roads, buildings, rivers, and other features. It helps add ground information to satellite-based studies. |
- USGS (Landsat 8 & 9)

FIG- These are American satellites that take detailed pictures of Earth’s surface every few days. They help track vegetation, water bodies, urban growth, and changes in land over time.
- Copernicus Sentinel-2

FIG- European satellites that capture high-quality images of the Earth in colour and infrared. They are useful for studying forests, crops, water, and environmental changes.
- MODIS

The FIG-A sensor on NASA’s Terra and Aqua satellites 33provides daily global images. It helps monitor large-scale changes like wildfires, droughts, and climate patterns.
- FIRMS (Fire Information for Resource Management System)

FIG-A NASA system that shows near-real-time fire locations around the world using data from MODIS and VIIRS satellites. It helps track and manage wildfires
.
- OpenStreetMap (OSM)

Fig- A free, community-made world map that includes roads, buildings, rivers, and other features. It helps add ground information to satellite-based studies.
Satellite Image- Landsat 7
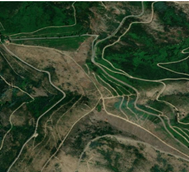

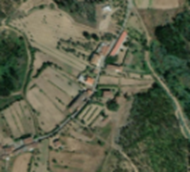
Satellite Images- Landsat 8

Satellite Images- Landsat 9

Satellite Images- Sentinel 1


Satellite Images- Sentinel 2

Satellite Image- MODIS


SRTM DEM
MODIS- VIIR

Platforms Used
Google Earth Engine
 |
Google Earth Engine is an online platform that lets you use satellite images from around the world without downloading anything. |
ArcGIS
 |
ArcGIS is a mapping software used to create, analyse, and visualise maps. |
QGIS
 |
QGIS is a free mapping software similar to ArcGIS. |
Python
 |
Python is a programming language that can process large amounts of data. |
ERDAS
 |
ERDAS is a software used mainly for analysing satellite images. |
 |
 |
 |
 |
Methodology
The parameters on which we are focused are
Vegetation Health: When plants are lush and thick, there’s more material to burn. In summer, if that greenery dries out, it becomes like stacked firewood ready to catch.
Plant Moisture: Dry plants burn quickly; wetter plants slow or stop flames. After hot, rain-poor weeks, plants lose moisture and fires race ahead.
Burn damage: Areas recently scorched can hide hot spots and embers. Winds can pick those up and start new flames nearby.
Slope (steep ground): Fire climbs uphill much faster than it moves on flat land because heat rises and pre-heats the grasses and shrubs above it.
Dense Vegetation: Thick, bushy cover lets flames jump from plant to plant. Open, well-spaced areas give firefighters a better chance to stop it.
Rainfall: When there’s been little recent rain, grasses and shrubs dry out like tinder. Good, steady rain keeps the landscape damp and less likely to ignite.
Ground temperature: Very hot days bake the soil and plants. Heat, together with wind, makes sparks catch more easily and pushes flames forward.
Nine locations have been selected to assess the actual impact of these parameters on the spread of wildfires.
Australia ‘Black Summer'( 2019-2020)
| Epicentre / Origin | Gospers Mountain, Wollemi National Park (ignited by lightning) |
| City / Region | Hawkesbury & Lithgow areas, New South Wales |
| Affected Area | 18.6 million hectares across Australia overall; Gospers |
| Date of Breakout | 26 Oct 2019 |
| Duration(to containment / major
control) |
79 days (26 Oct 2019 to 12 Jan 2020) |
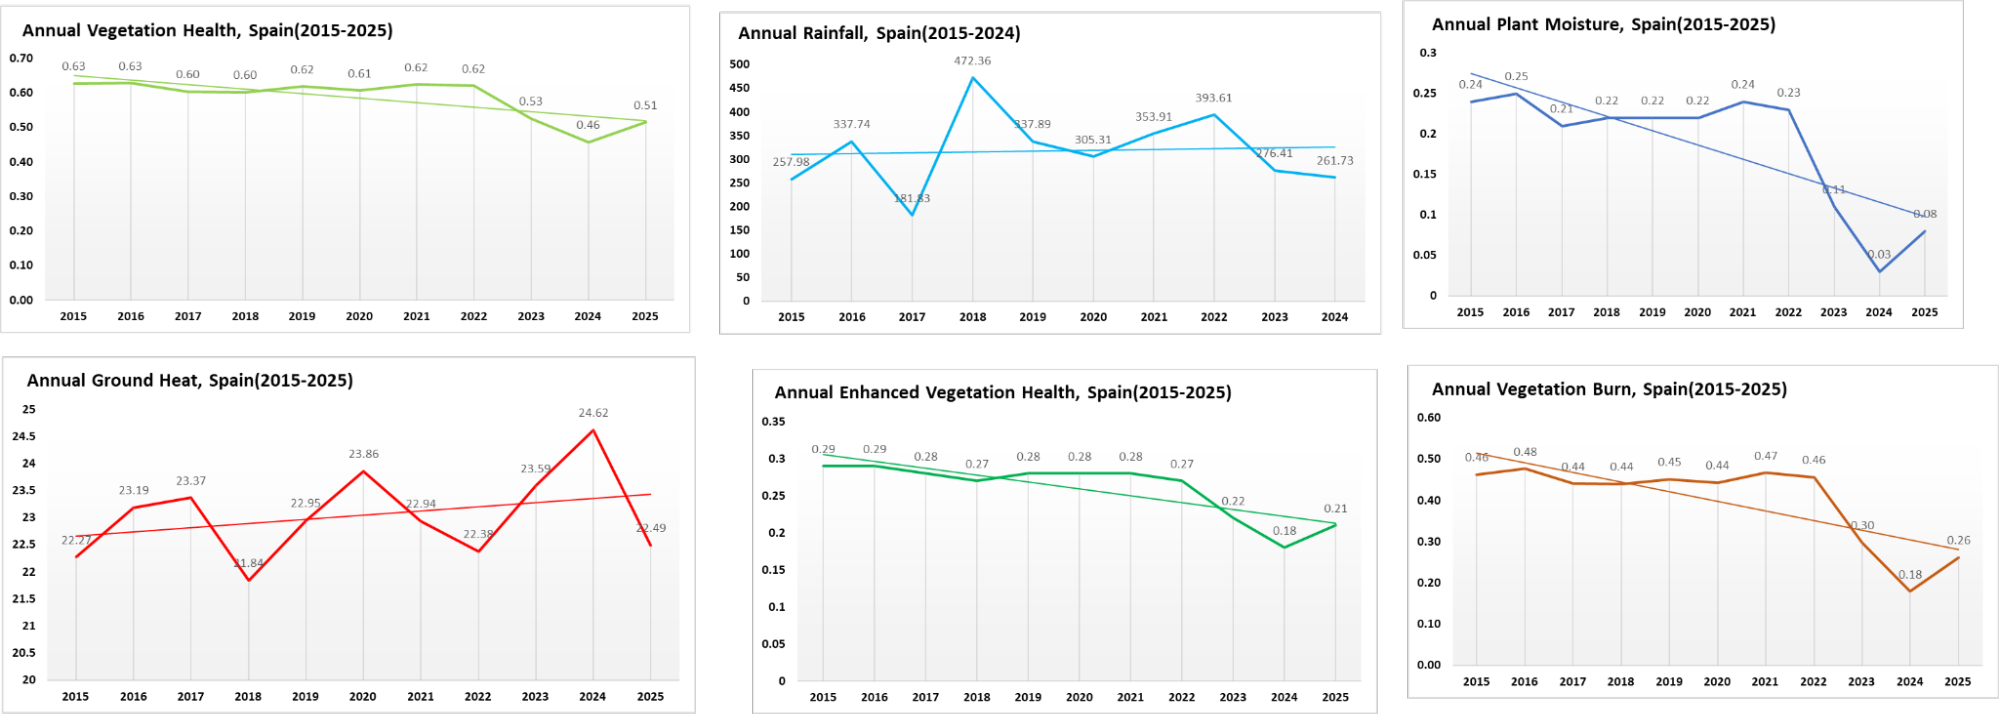
Monitoring the parameters in these areas is conducted using satellite images from 2015 to 2025, on a monthly, seasonal, and annual basis. This allows for a detailed analysis of trends and behaviour of these parameters. By examining the conditions surrounding the outbreak of fires, we can better understand how the values and behaviours of these parameters change during such events and how they may contribute to the spread of forest fires.
Now the question arises again: why are these parameters important in wildfire spread, and why are we focusing on them?
Therefore, these parameters were thoroughly analysed in detail to obtain the answer to the question, which is why they are important.
-
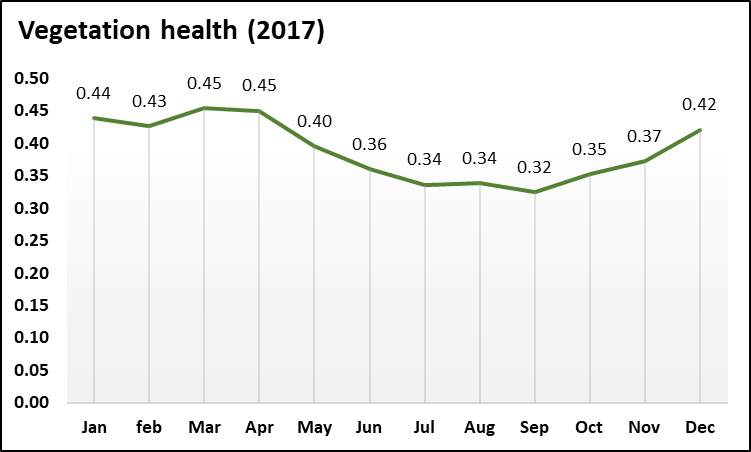
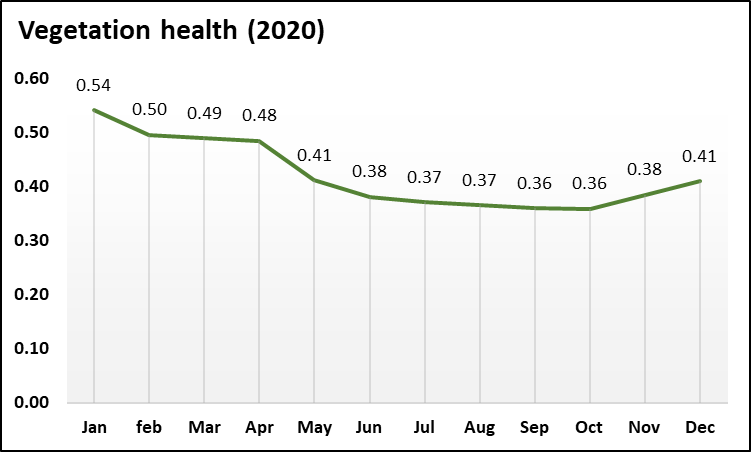
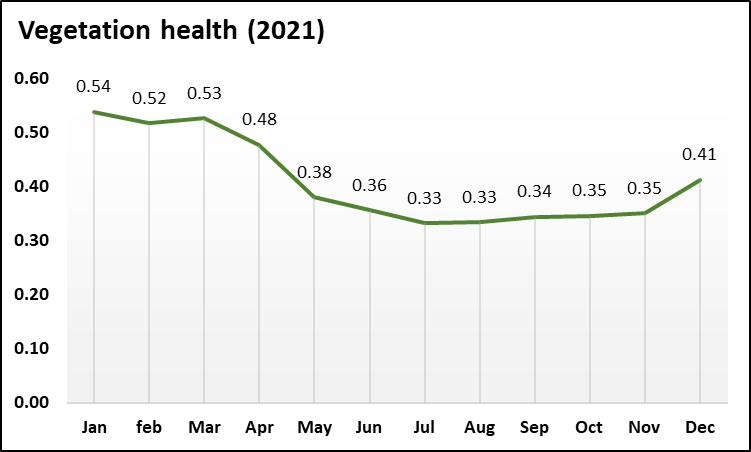
Vegetation health
Annual Change in Vegetation Health.

The pattern of vegetation health in the area where the fire broke out is shown in Graph 1. In 2016, the vegetation health index was 0.75, indicating good condition. However, since then, it has steadily declined. This decrease in vegetation health has led to an increase in fuel for the fire. As vegetation health diminishes, moisture is lost, causing the vegetation to dry out and become more susceptible to catching fire.
-
Plant Moisture
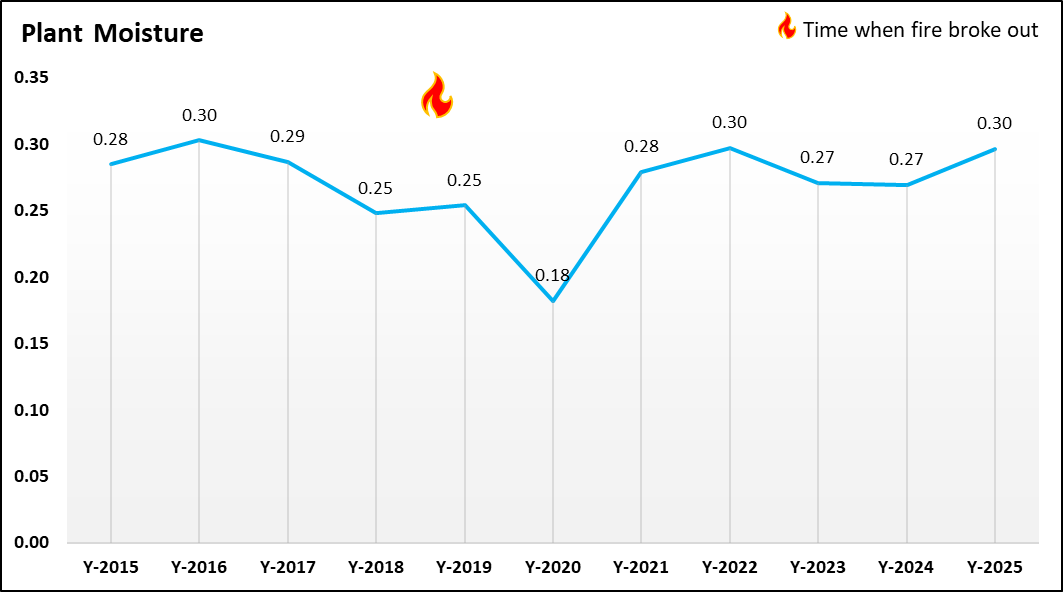
This graph illustrates the trend of plant moisture in the area where a fire broke out between 2015 and 2025. It clearly shows that plant moisture began to decline in 2017, with a significant drop leading up to the megawildfire. During this time, plant moisture levels were notably lower compared to other years. As the moisture content decreases, plants become drier, making them more susceptible to catching fire. Thus, the graph demonstrates that plant moisture is a crucial parameter in the spread of wildfires.
-
Burn damage
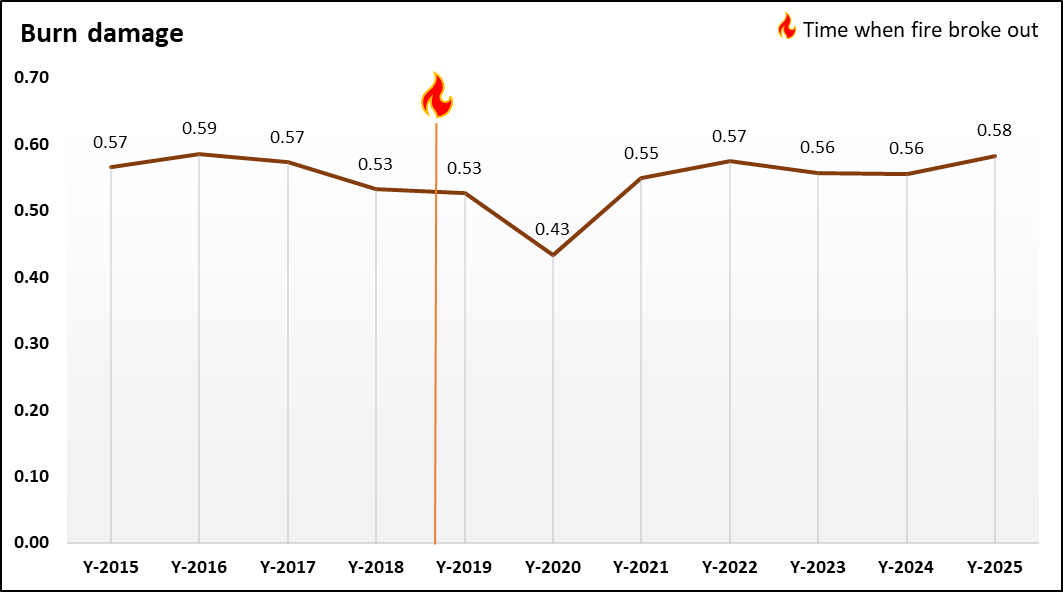
The graph above illustrates burn damage areas that have been recently scorched. These areas can conceal hot spots and embers, which winds can carry to ignite new flames nearby. When burn damage is less severe, the risk of wildfires increases because a higher burn damage value indicates a healthier area. The graph shows a decline in these values since 2016, and the current values are lower compared to previous years. This indicates that burn damage plays a significant role in the spread of wildfires.
-
Dense Vegetation
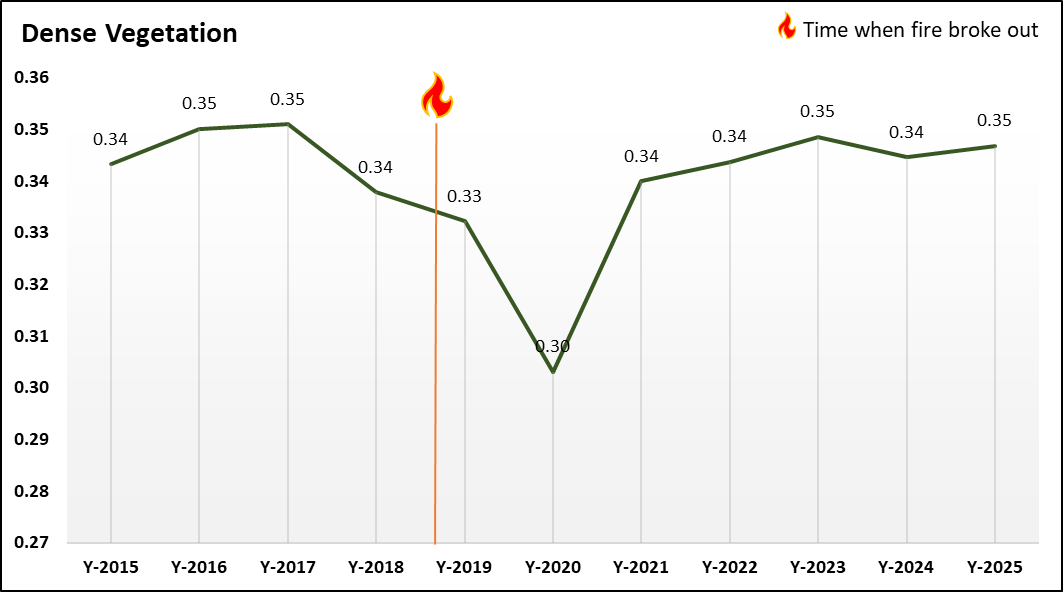
The pattern of dense vegetation in the area where the fire broke out is shown in Graph 2. From 2015 to 2017, the dense vegetation index stayed around 0.34–0.35, meaning the area had plenty of thick, healthy plants. From 2018 (0.34) to the fire year 2019 (0.33), this index started to slowly fall, showing that the dense vegetation was already thinning before the fire. Right after the fire, in 2020, the index dropped sharply to about 0.30, which means a large part of the dense vegetation was lost. In the years after the fire (2021–2025), the index gradually increased again to around 0.34–0.35, indicating that dense vegetation has been recovering, but this regrowth took several years.
-
Ground temperature
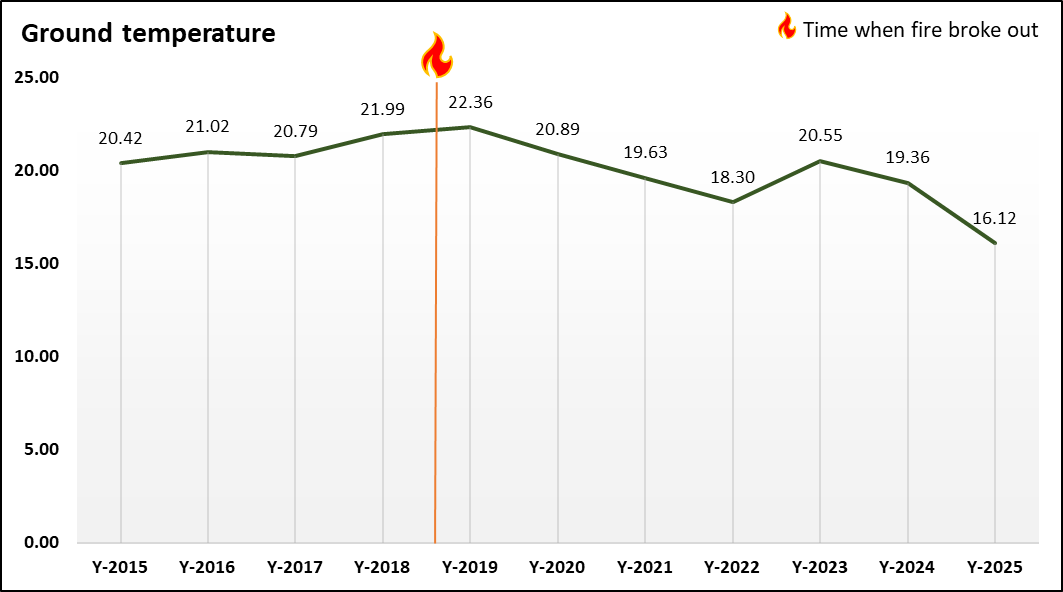
The pattern of ground temperature in the area where the fire broke out is shown in Graph 3. From 2015 to 2019, ground temperature rose gradually from about 20.4°C to a peak of around 22.4°C in 2019, the year of the fire. After the fire, temperatures started to fall, dropping to about 18.3°C by 2022. There was a short-term increase in 2023 (around 20.6°C), but by 2025 the ground temperature had decreased further to about 16.1°C. Overall, the graph shows that ground temperatures were higher in the years leading up to the fire and generally cooler in the years after it.
-
Rainfall
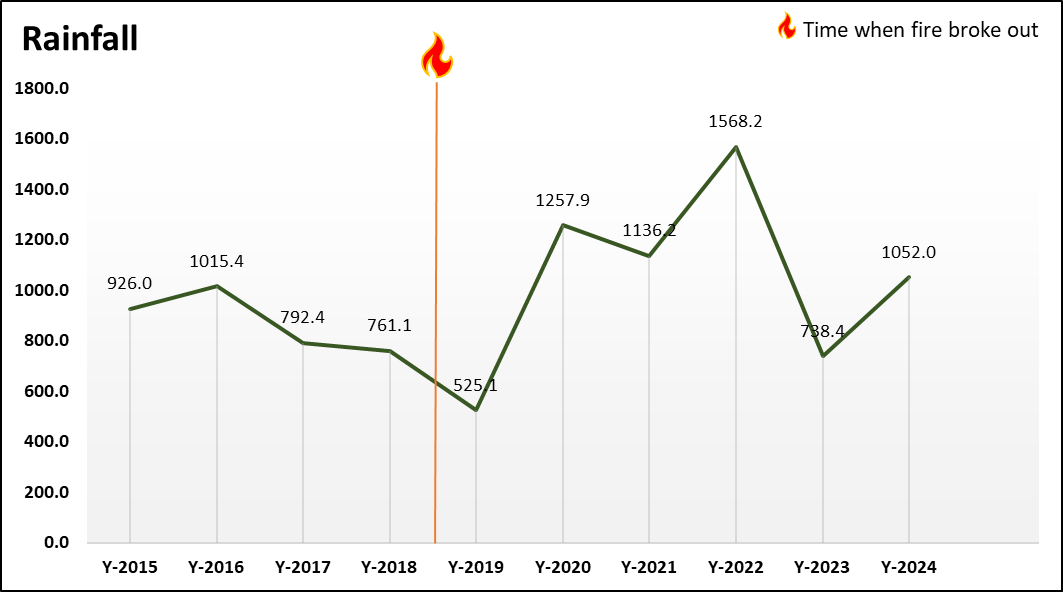
-The pattern of rainfall in the area where the fire broke out is shown in this graph. From 2015 to 2018, yearly rainfall stayed at a moderate level, between about 760 and 1,015 mm. In 2019, the year of the fire, rainfall dropped sharply to around 525 mm, meaning the area was much drier than in the previous years. After the fire, rainfall increased strongly: 2020, 2021 and especially 2022 were very wet years, which likely helped the land start recovering. Rainfall then decreased in 2023 but rose again in 2024 to a little over 1,050 mm, showing that, overall, the years after the fire were wetter than the fire year itself.
We will compare all the parameters regarding their conditions at the time the fire broke out to determine the relationship between the wildfire and the respective parameters.

We can clearly observe that several parameters are conducive to the spread of wildfires. For instance, vegetation health has declined, and vegetation moisture levels have also decreased, resulting in drier conditions. Additionally, the low levels of burn damage suggest that there are many dry bushes and grasses that can easily transfer fire from one area to another. Rising temperatures further contribute to dryness, making the area more vulnerable to wildfires.
Furthermore, a decline in rainfall indicates that there is less moisture available during that season.
All these conditions increase the likelihood of wildfire spread. This highlights the importance of understanding these parameters in predicting which areas are more susceptible to wildfires.
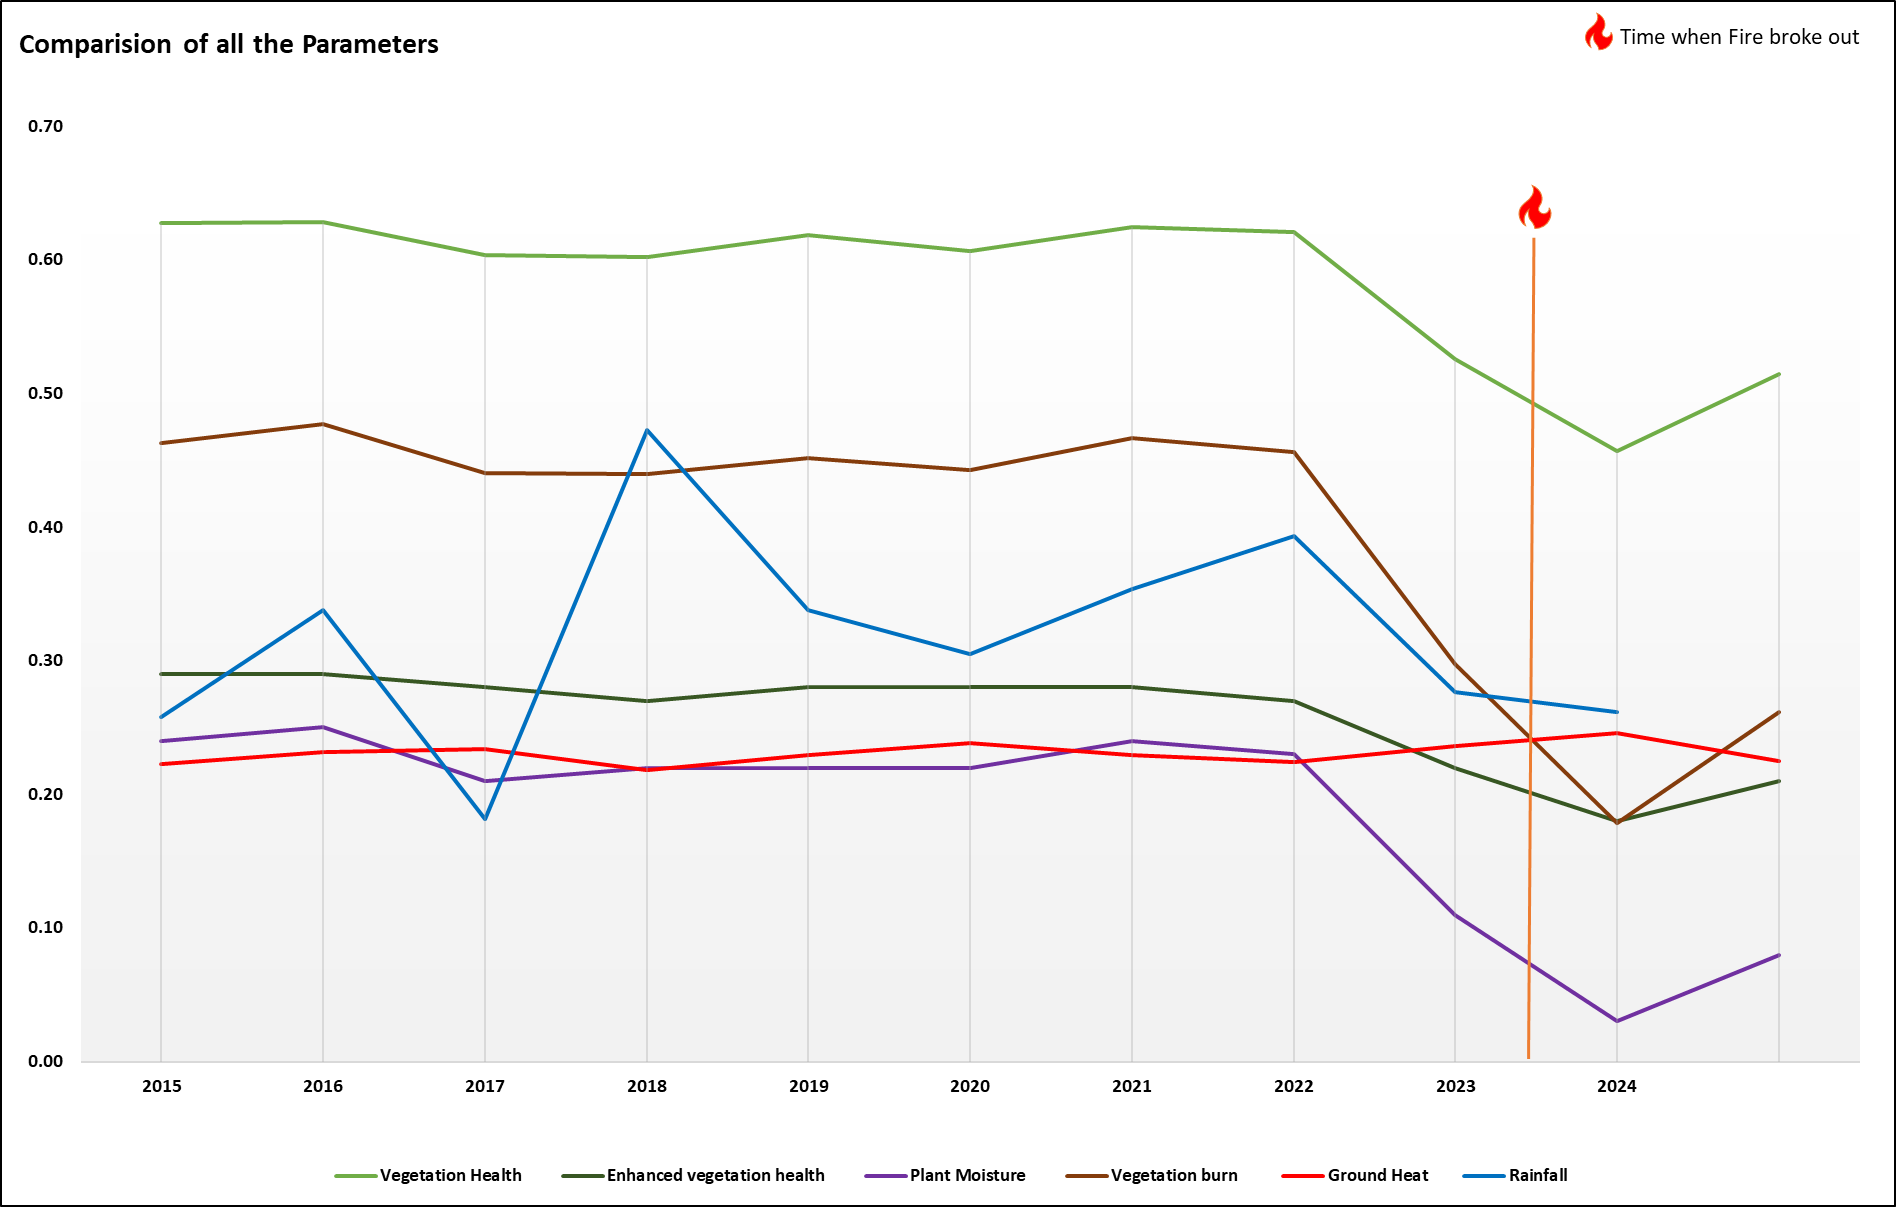
Chile Valparaíso Region Wildfires (15 Feb 2024)
| Epicentre / Origin | Hills between Viña del Mar and Quilpué (near Lago Peñuelas) |
| City / Region | Viña del Mar, Quilpué and surrounding communes, Valparaíso
Region |
| Affected Area | 6,800 ha burned |
| Date of Breakout | 01 Feb 2024 |
| Duration(to containment / major
control) |
5 days (01 Feb 2024 to 05 Feb 2024) |
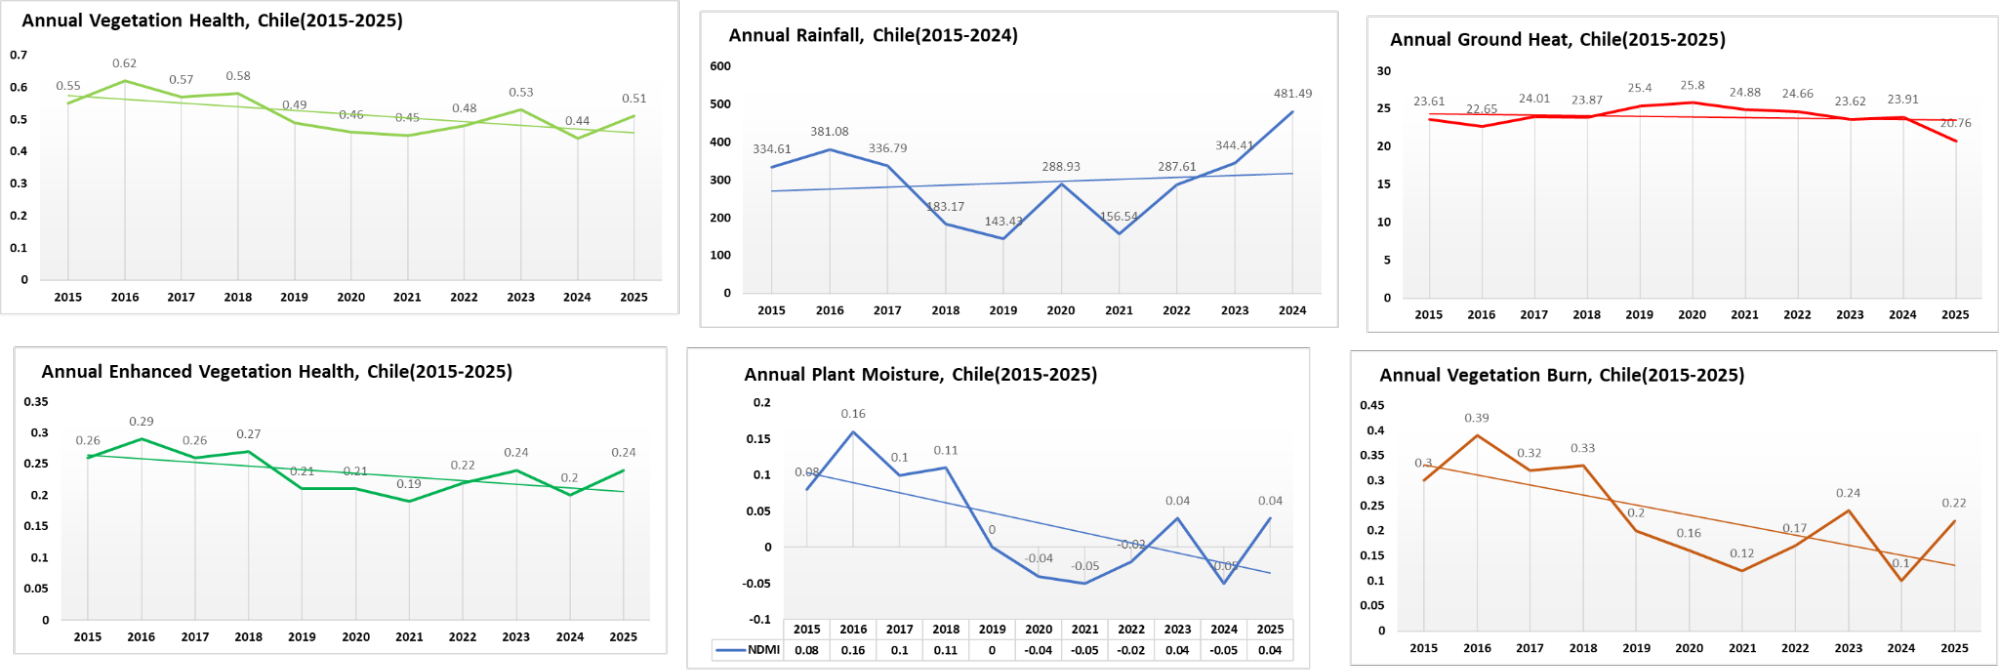

This graph compares how all key parameters have changed from 2015 to 2024 and helps explain why the wildfire that broke out on 01 February 2024 found such favourable conditions. Over the years, overall vegetation health and enhanced vegetation health rise and fall but never return to the very strong levels seen around 2016–2017 for long. There are periods where vegetation becomes thinner and more stressed, especially around 2018–2021, which weakens the natural barrier against fire.
Plant moisture shows a clear drop in the middle years and, although it improves again, it stays below the safest levels while ground heat remains steadily high. This means plants are often warmer and drier than before. Burn-related values stay relatively low in some years, which suggests that a lot of dry grasses and shrubs are still available as fuel rather than already cleared by previous fires. At the same time, rainfall does not stay consistently high and tends to decrease after the wettest years, reducing the amount of fresh moisture in the landscape. Taken together, by early 2024, the combination of stressed vegetation, limited moisture, warm ground and available dry fuel created a setting where a single spark could quickly grow into a wildfire.
United States Southern California (Los Angeles) (Jan 2025)
| Epicentre / Origin | Pacific Palisades |
| City / Region | Los Angeles, Southern California |
| Area Affected | 2,000 ha |
| Date of Breakout | 7Jan 2025 |
| Duration (to containment / major control) | 24 days (7 Jan 2025 to 31 Jan 2025) |
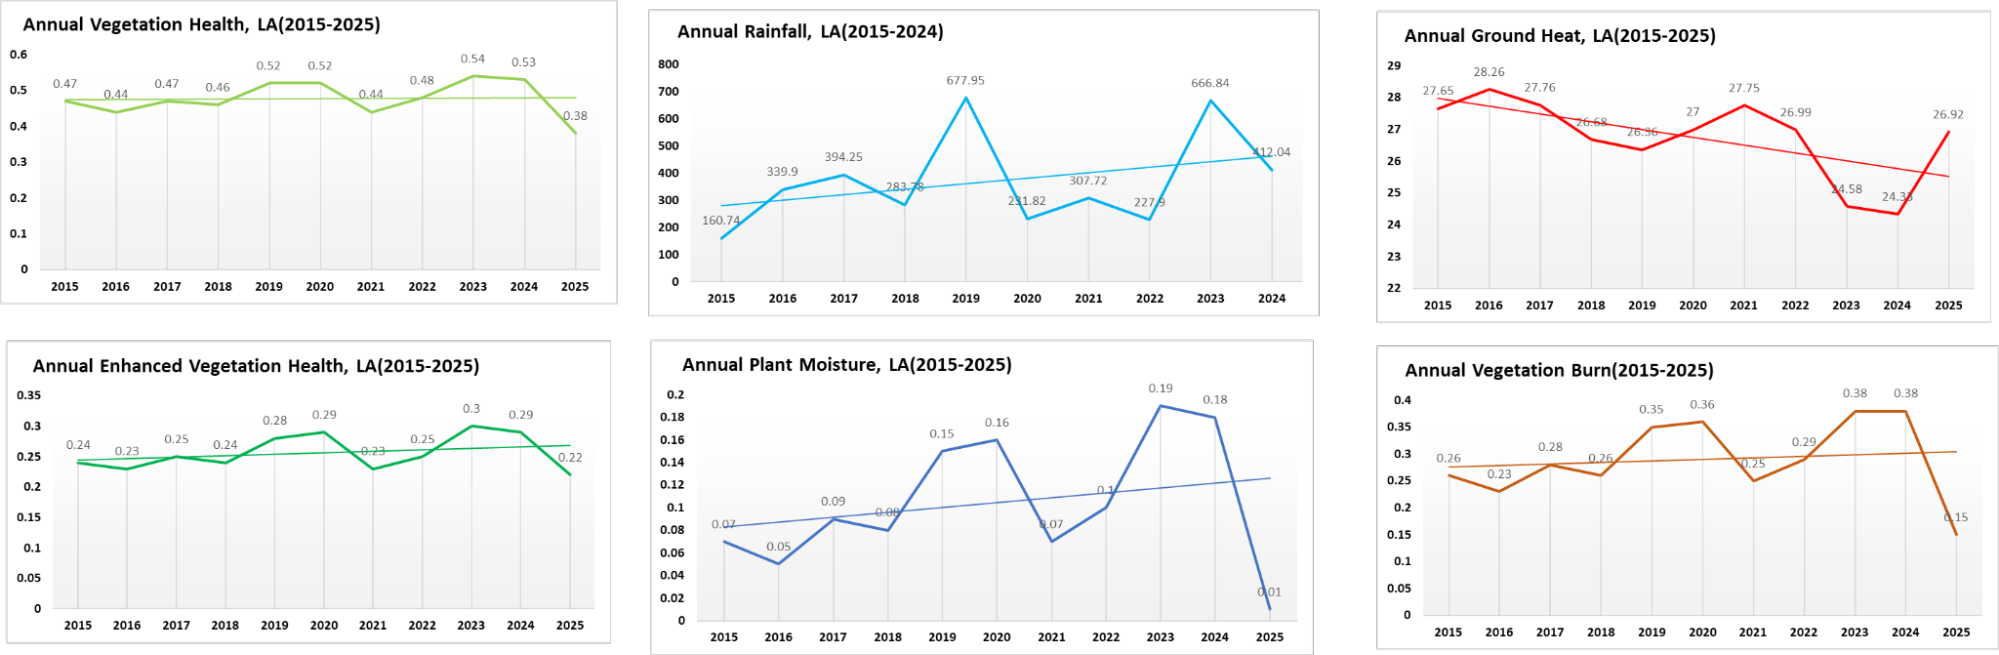

This graph compares how all key parameters changed from 2015 to 2024 and helps explain why the wildfire that broke out on 7 January 2025 found such favourable conditions.
Over the years, vegetation health and enhanced vegetation health have stayed fairly strong and even risen in several years. By 2023–2024, vegetation is still quite healthy, which means there is plenty of plant material available as fuel rather than bare soil.
At the same time, plant moisture shows sharp ups and downs. After a very wet spike in 2023, values fall in 2024, so plants enter late 2024 and early 2025 with less water stored in their leaves and branches. The vegetation burn line climbs steadily and is highest in 2023–2024, suggesting more areas that are scorched, dry or surrounded by dead grasses and shrubs that can easily catch fire.
Ground heat slowly increases over the period, keeping surfaces warmer, while rainfall drops sharply in 2024 after a few relatively better years. This means that just before January 2025, the land has strong but dry vegetation, rising burn stress, warm ground and very little recent rain.
All these conditions together greatly increase the chance that a spark on 7 January 2025 could grow quickly into a wildfire. This underlines why tracking these parameters over time is so important for predicting which years and seasons are most vulnerable to fire.
Spain Tenerife Wildfire (Canary Islands) (Aug Sept 2023)
| Epicentre / Origin | Forested slopes between Arafo and Candelaria (near Mount Teide) |
| City / Region | Municipalities of Arafo, Candelaria, La Orotava, La Victoria, Santa Úrsula |
| Area Affected | 14,600–15,000 ha |
| Date of Breakout | 15 Aug 2023 |
| Duration (to containment / major control) | 41 days (15 Aug 2023 to 24 Sep 2023) |
This graph compares all key parameters from 2015 to 2024 and helps explain why the wildfire on 15 August 2023 could spread so easily. By 2023, vegetation health is still fairly strong, so there is plenty of plant material available as fuel. At the same time, enhanced vegetation health and especially plant moisture decline compared with the wetter years around 2018 and 2020–2022, meaning the plants are greener in area but drier inside.
While vegetation burn starts to drop in 2023, it follows several earlier years with higher burn stress, which likely left behind dry branches, grasses and dead material on the ground. Ground heat slowly increases through the period and remains high by 2023, matching the hot summer conditions in August. Rainfall also decreases sharply from 2022 to 2023, so the landscape enters summer with less recent rain and very limited moisture recharge.
Together, healthy-but-dry vegetation, leftover dry fuel, rising ground heat and reduced rainfall create ideal conditions for a fire to ignite and spread in mid-August 2023. This combination shows how important it is to track these parameters together when assessing wildfire risk.
United States, Texas: Smokehouse Creek Fire (Feb Mar 2024)
| Epicentre / Origin | 1 mile north of Stinnett, Hutchinson County (near CR 11 & CR O) |
| City / Region | Texas Panhandle (Hutchinson, Roberts, Hemphill counties) & western Oklahoma |
| Area Affected | 428,352 ha |
| Date of Breakout | 26 Feb 2024 |
| Duration (to containment / major control) | 20 days (26 Feb 2024 to 16 Mar 2024) |

This graph compares all the key conditions from 2015 to 2024 and shows why the landscape was vulnerable when the fire broke out on 26 February 2024. By 2024, vegetation health is still reasonably strong, so there is plenty of grass, shrubs and trees available as fuel rather than bare ground. However, plant moisture has dropped compared with the very wet year 2015 and is also lower than in 2023, which means that, even though the vegetation is present, it is drier on the inside.
At the same time, vegetation burn values remain negative, suggesting more stressed or damaged plants and more dry material on the ground that can catch fire easily. Ground heat stays relatively high across the years, so the surface is warm, and rainfall is low and mostly negative in 2024, showing that the area did not receive enough recent rain to recharge moisture before late winter.
Together, this mix of plenty of dry fuel, stressed vegetation, warm ground and limited rainfall created ideal conditions for a spark to turn into a wildfire on 26 February 2024. This underlines why watching all these parameters together is crucial for spotting high-risk periods in advance.
Now that the questions have been answered, it is clear that these parameters play an important role in the spread of wildfires. Understanding how the conditions of these parameters affect wildfire behaviour allows us to predict and map which areas are more vulnerable to wildfires if a fire were to break out.
But the question is that we know these parameters affect the spread of wildfire, but how can we predict the risk areas with the help of these parameters?
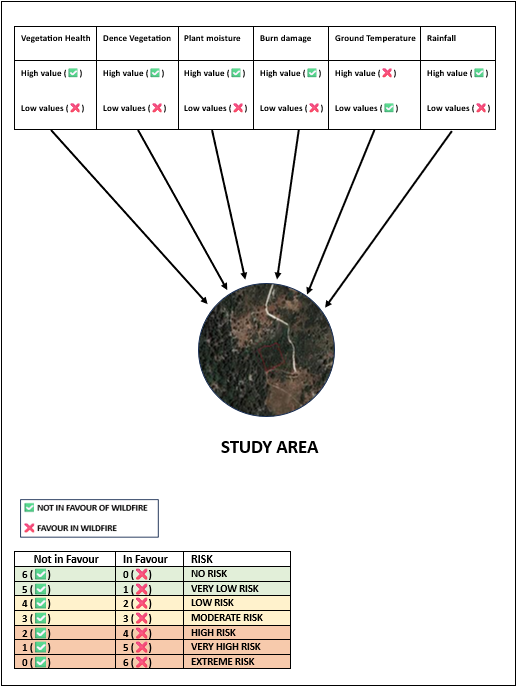
| Vegetation Health | Dense Vegetation | Plant moisture | Burn damage | Ground Temperature | Rainfall |
| High value (✅) | High value (✅) | High value (✅) | High value (✅) | High value (❌) | High value (✅) |
| Low values(❌) | Low values(❌) | Low values(❌) | Low values(❌) | Low values(✅) | Low values(❌) |
Flow charts to show the methodology of work flow.
Step 1. Check the importance of parameters.
The parameters have already been checked, and they play an important role in the spread of wildfires. This analysis was conducted across nine different locations where fires escalated into megafires. A thorough examination of satellite images and graphs clearly demonstrates how these parameters affect both the spread and intensity of wildfires.
Step 2. Select the Study area for which you want to make a Risk map.
The Limassol district has been selected to assess wildfire risk.
Step 3. Check all the parameters to determine whether they are favourable for a fire or not.
Check the value of all the parameters in Limassol with the help of satellite images, graphs and charts, and categorise the risk on the basis of the values of parameters, assigning the risk class to that area.
- If 6 parameters are in favour of fire, then that area will be at extreme risk.
- If 5 parameters are in favour of fire and 1 is not in favour of fire, then that area will be in a very high-risk zone.
- If 4 parameters are in favour of fire and 2 are not in favour of fire, then that area will be in a high-risk zone.
- If 3 parameters are in favour of fire and 3 are not in favour of fire, then that area will be in a moderate risk zone.
- If 2 parameters are in favour of fire and 4 are not in favour of fire, then that area will be in a low-risk zone.
- If 1 parameter is in favour of fire and 5 is not in favour of fire, then that area will be in a very low-risk zone.
- If zero parameters are in favour of fire and 6 is not in favour of fire, then that area will be in a no-risk zone.

Fig:- This figure shows the Layers and parameters used to Get Predicted fire risk area.
Currently, the parameters in Limassol for the time range 2015 to 2025 are being analysed in depth, and a map of risk classes has been prepared based on the values of these parameters.
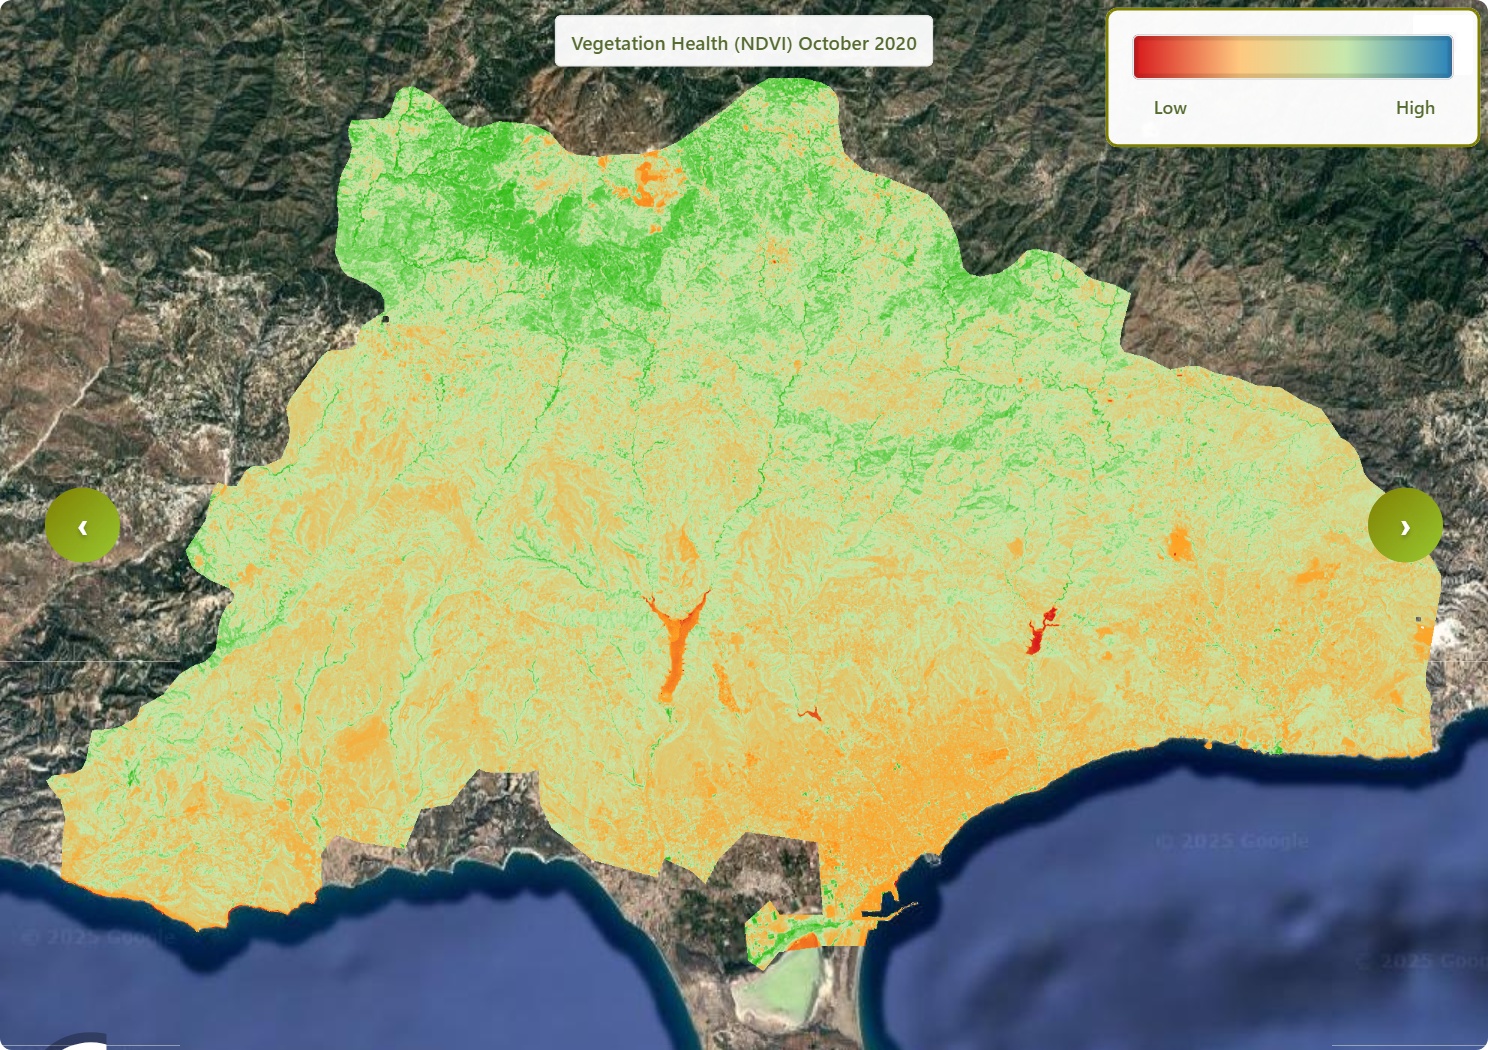
Data Analysis of Limassol.
-
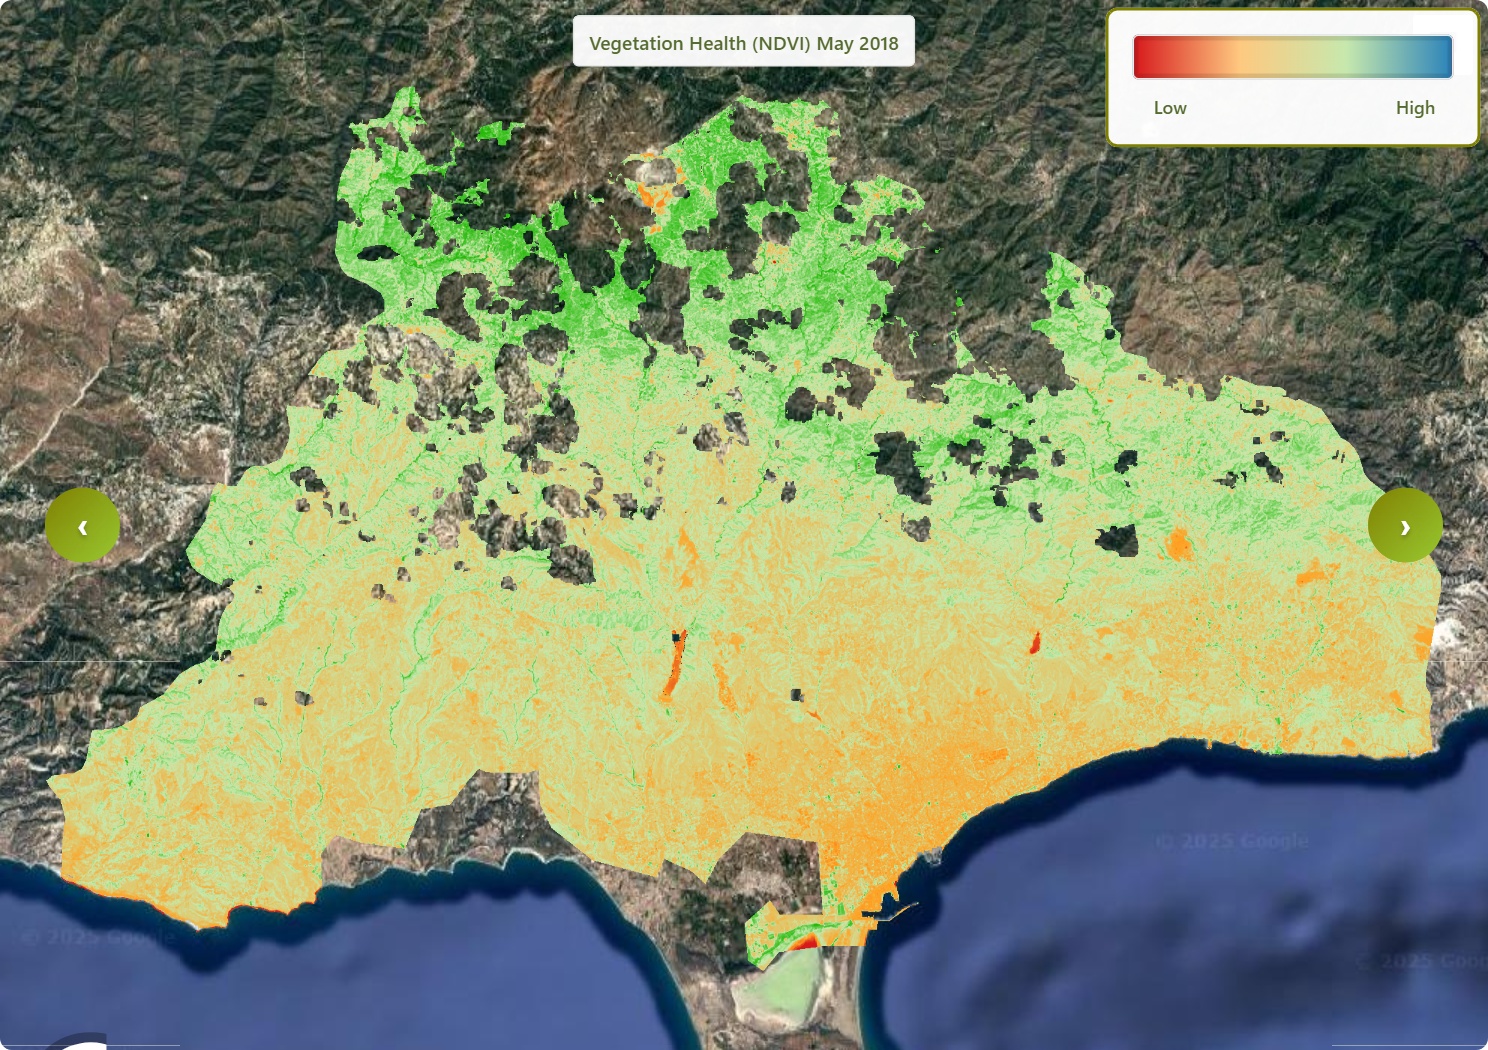
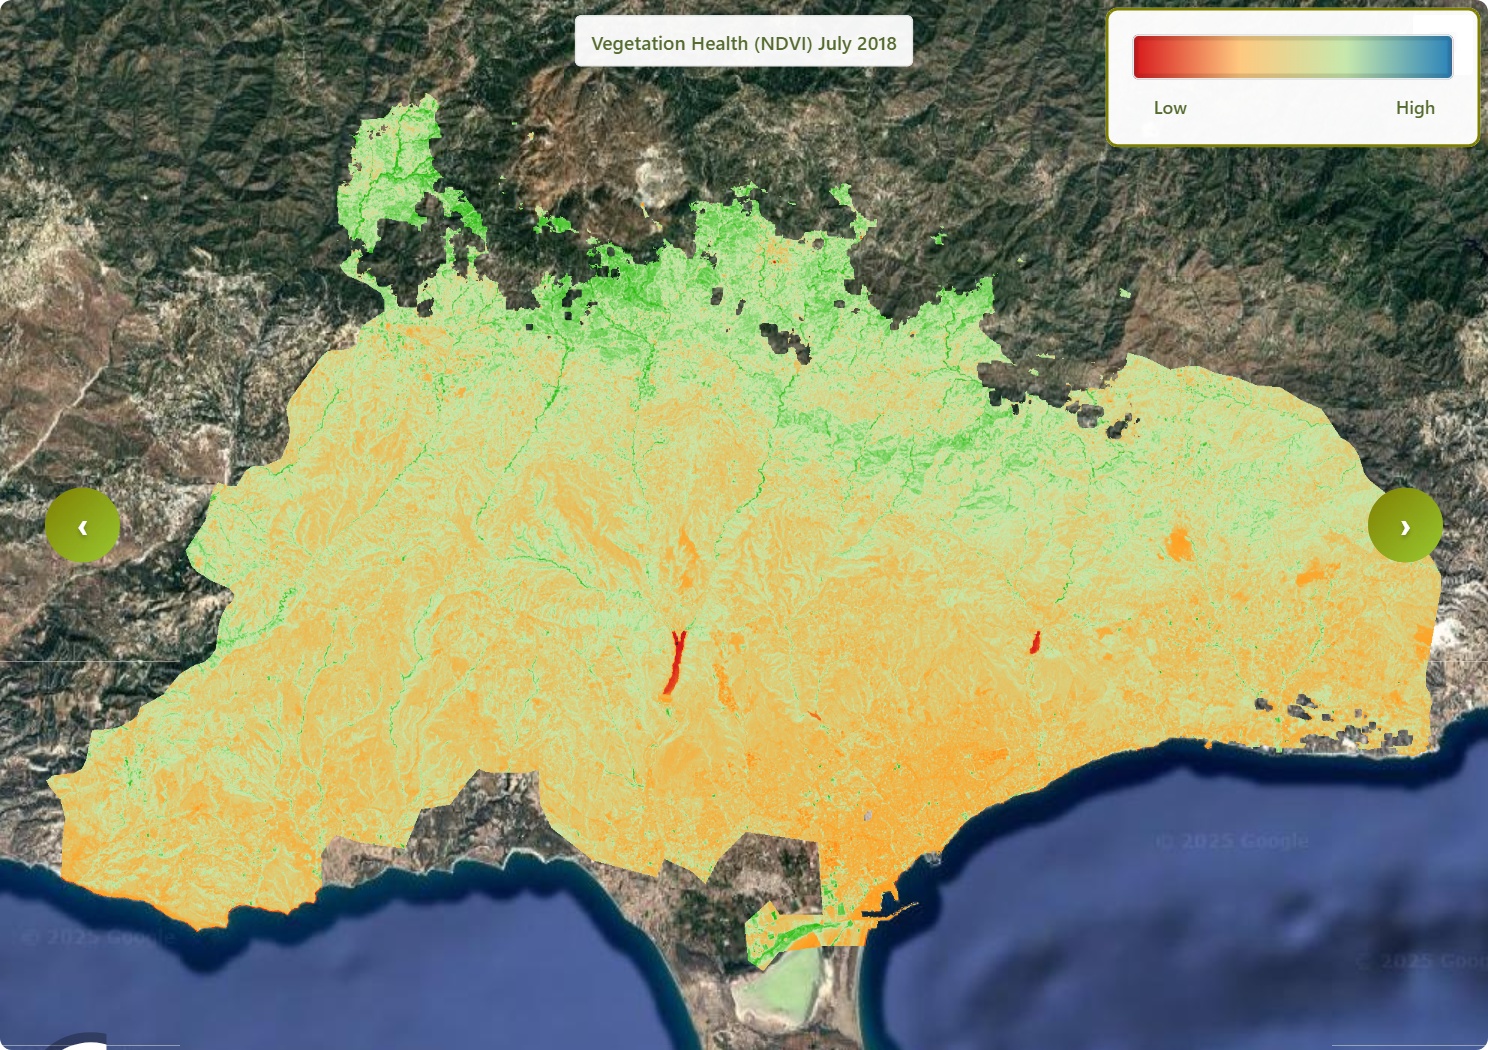
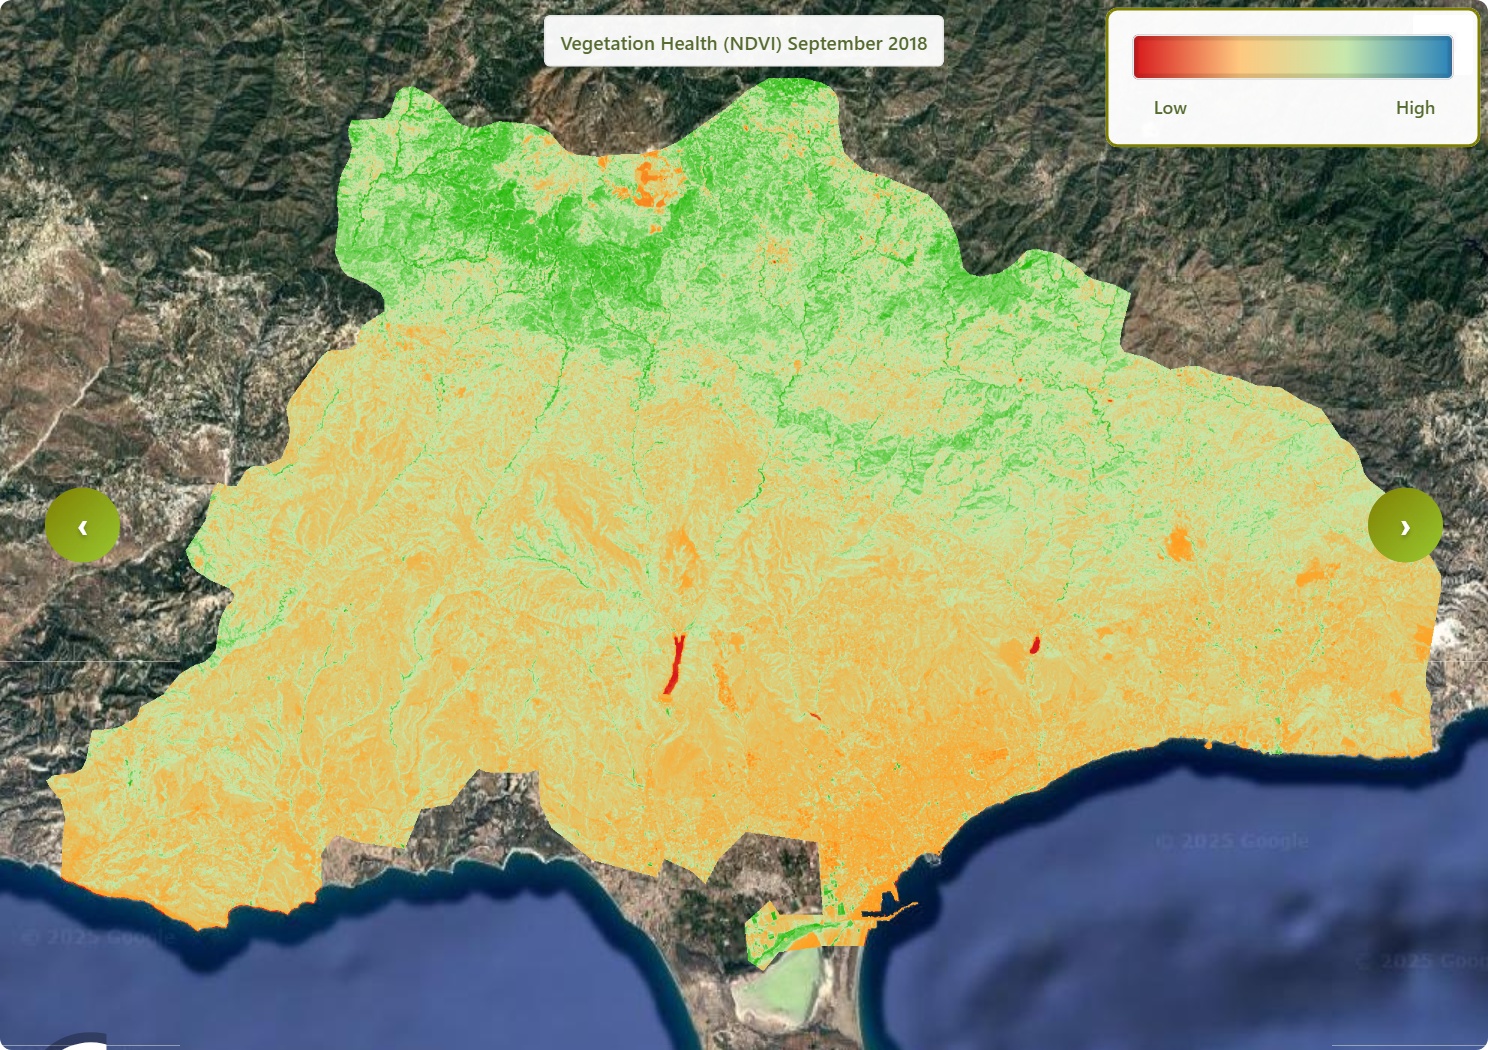
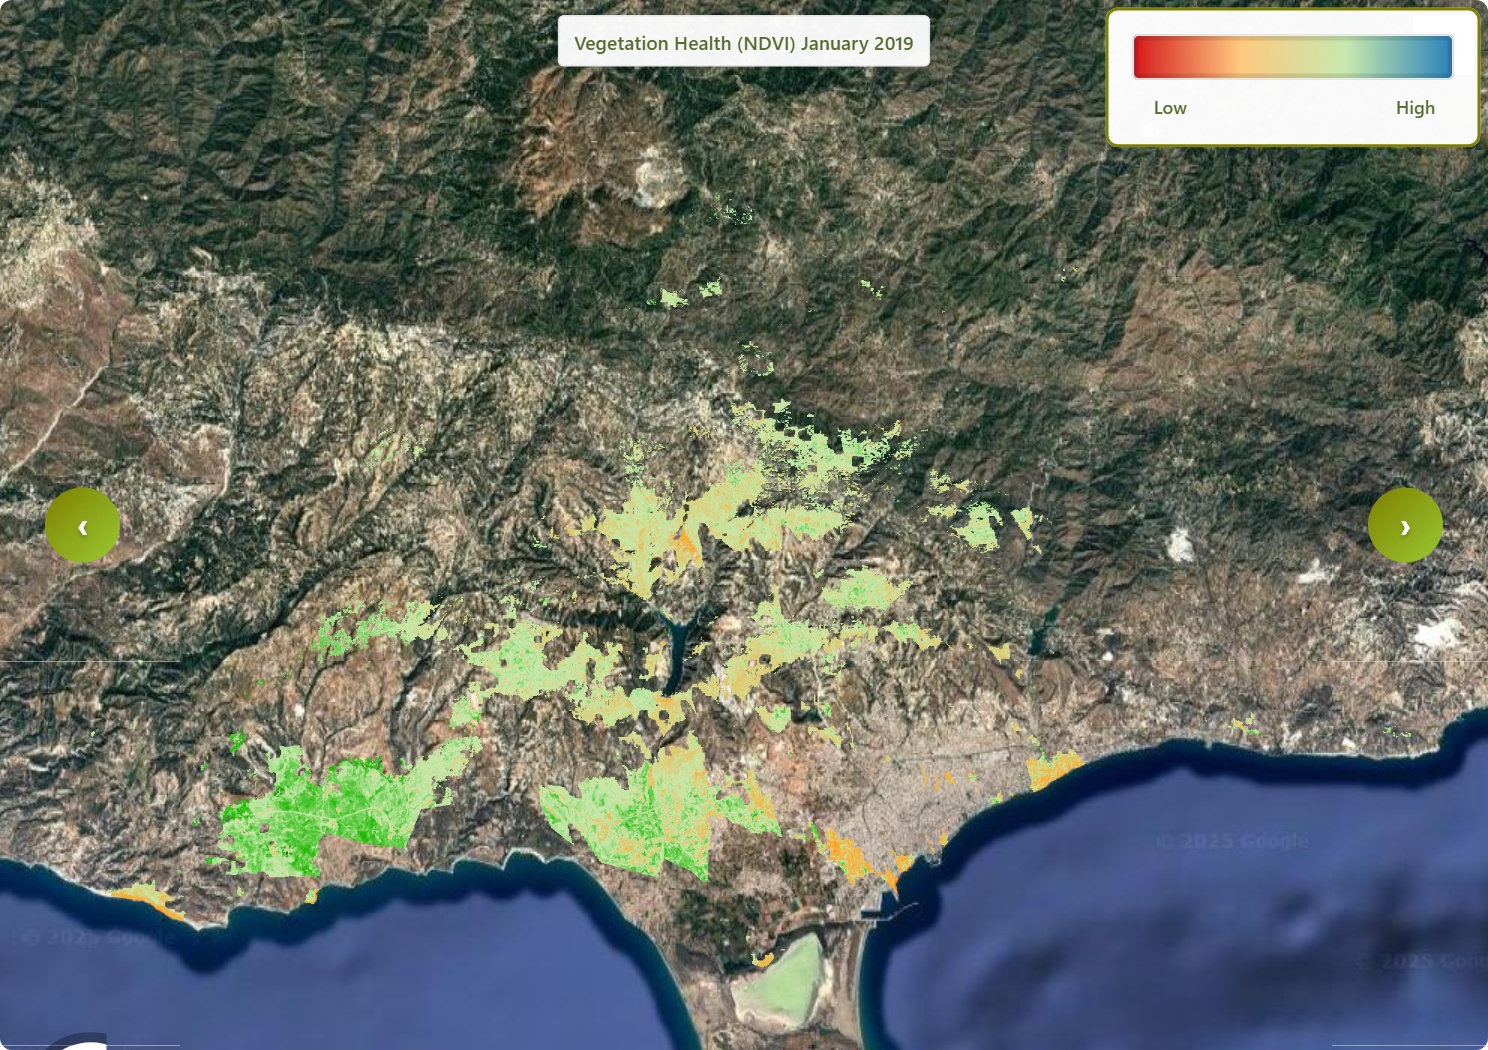
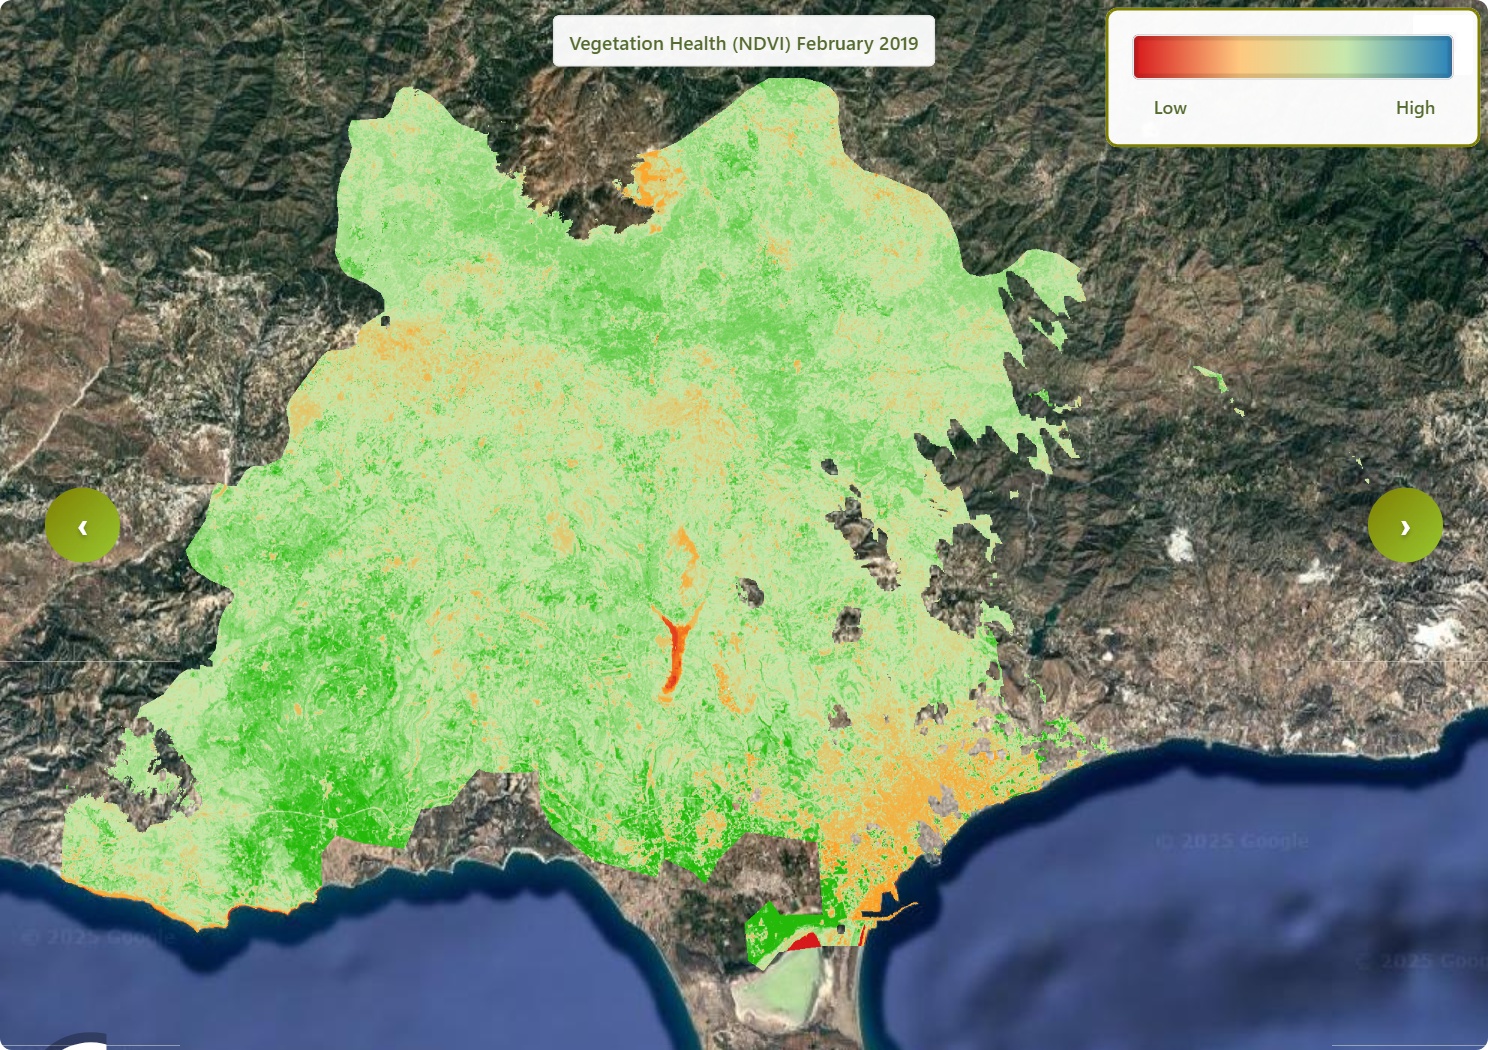
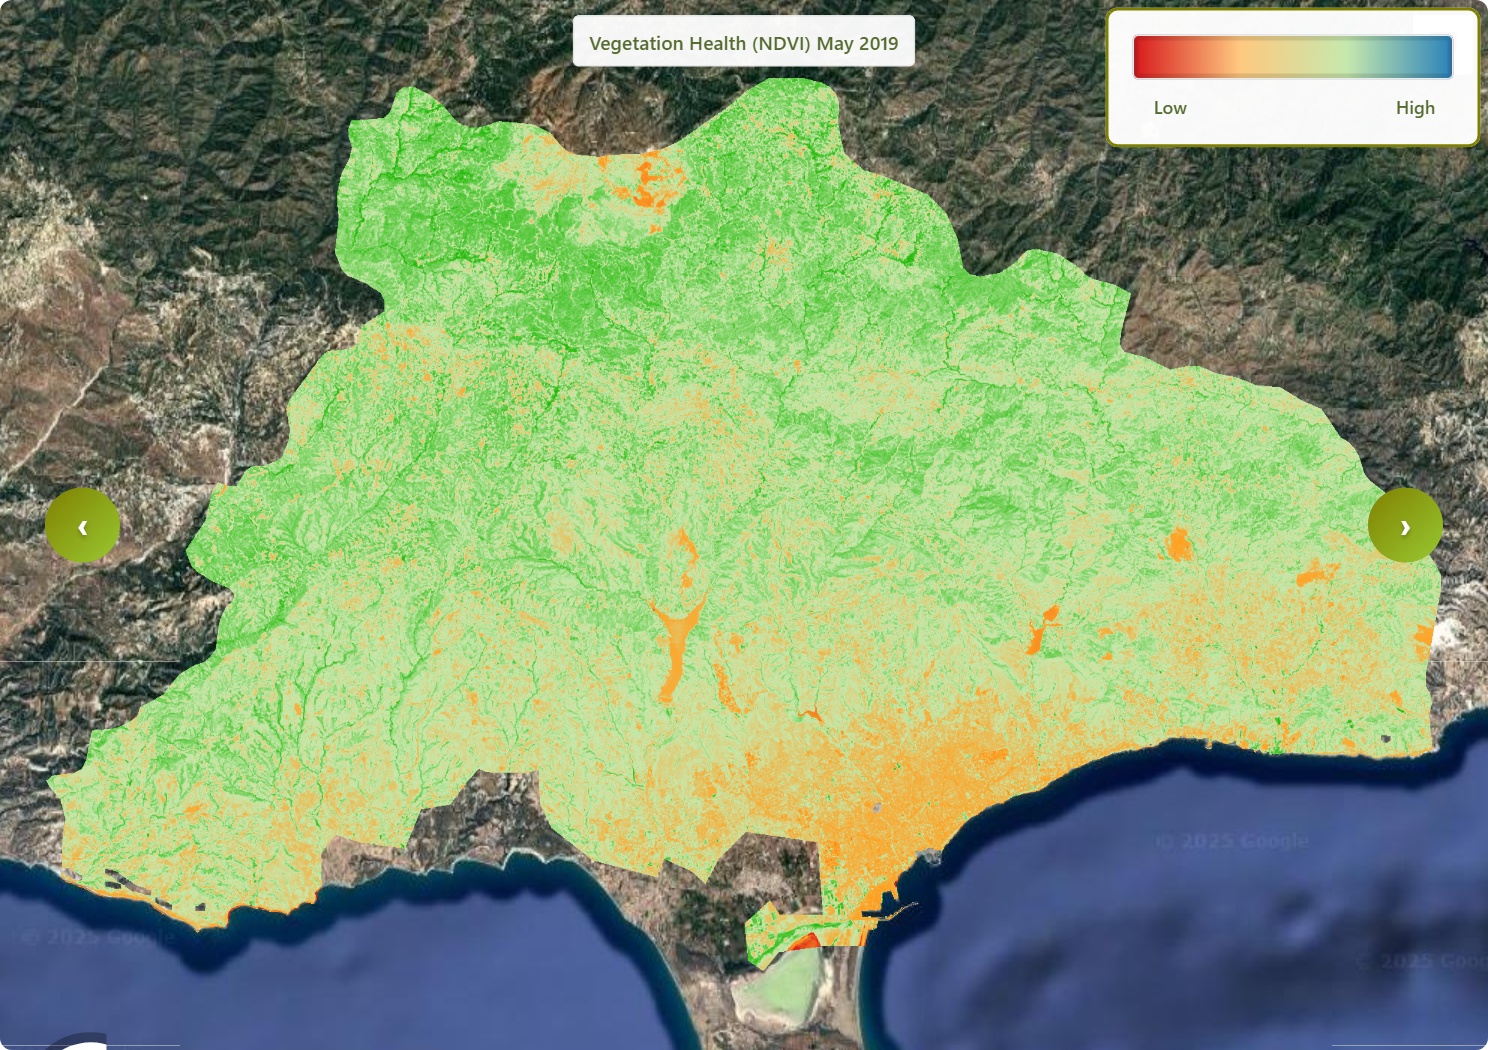
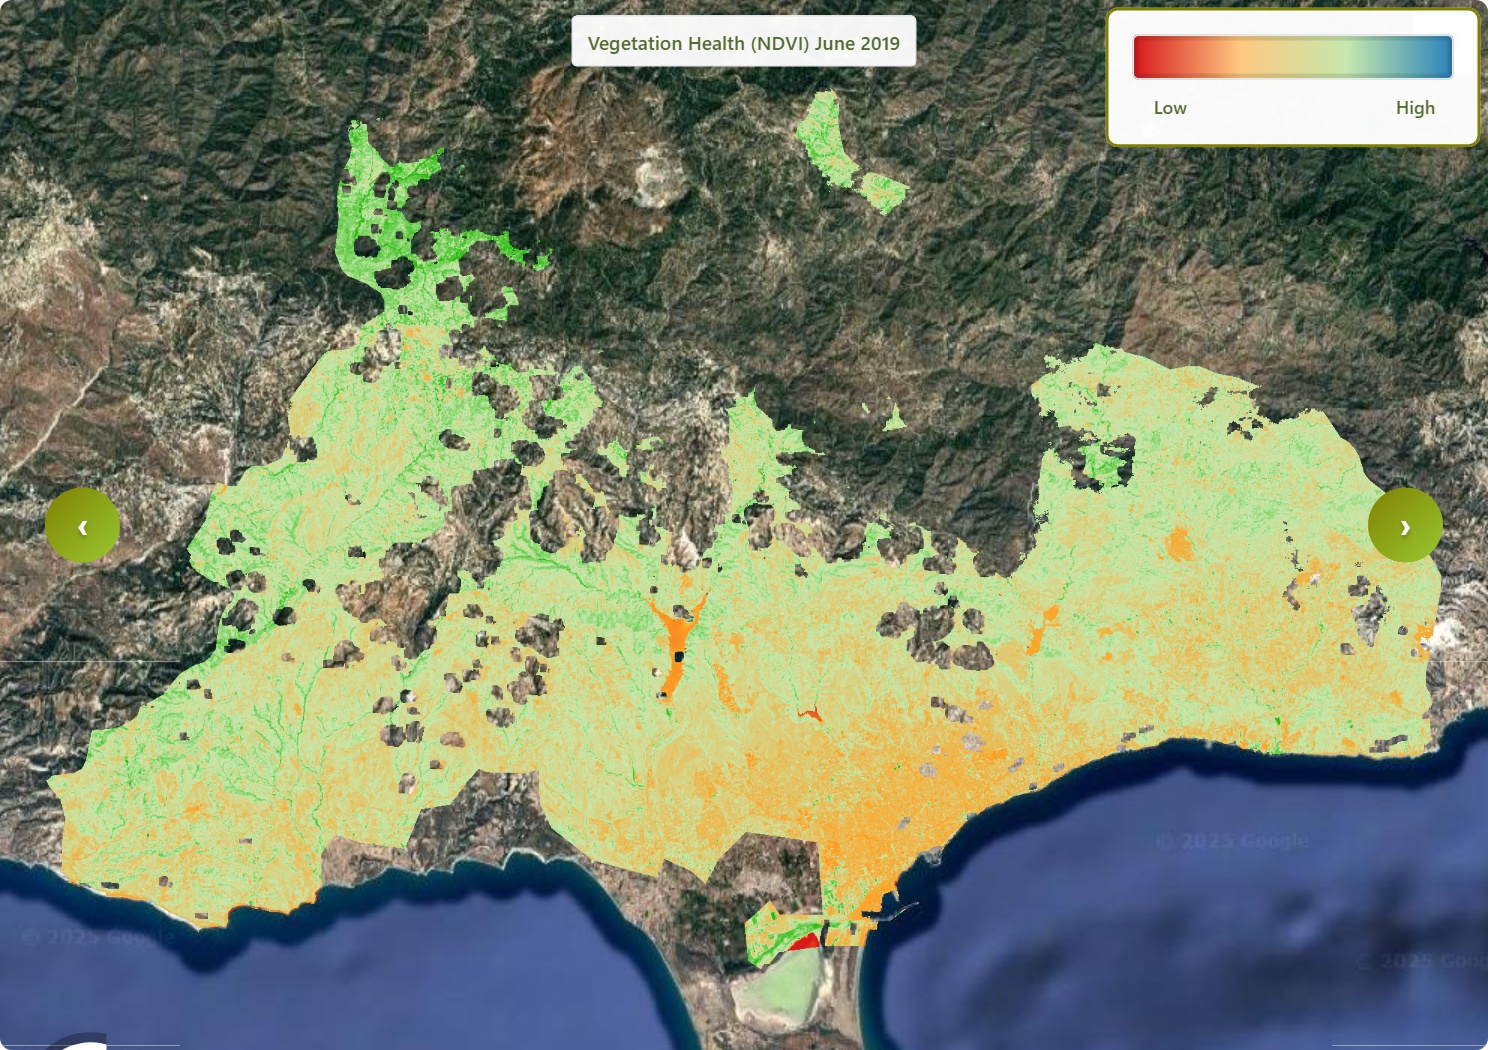
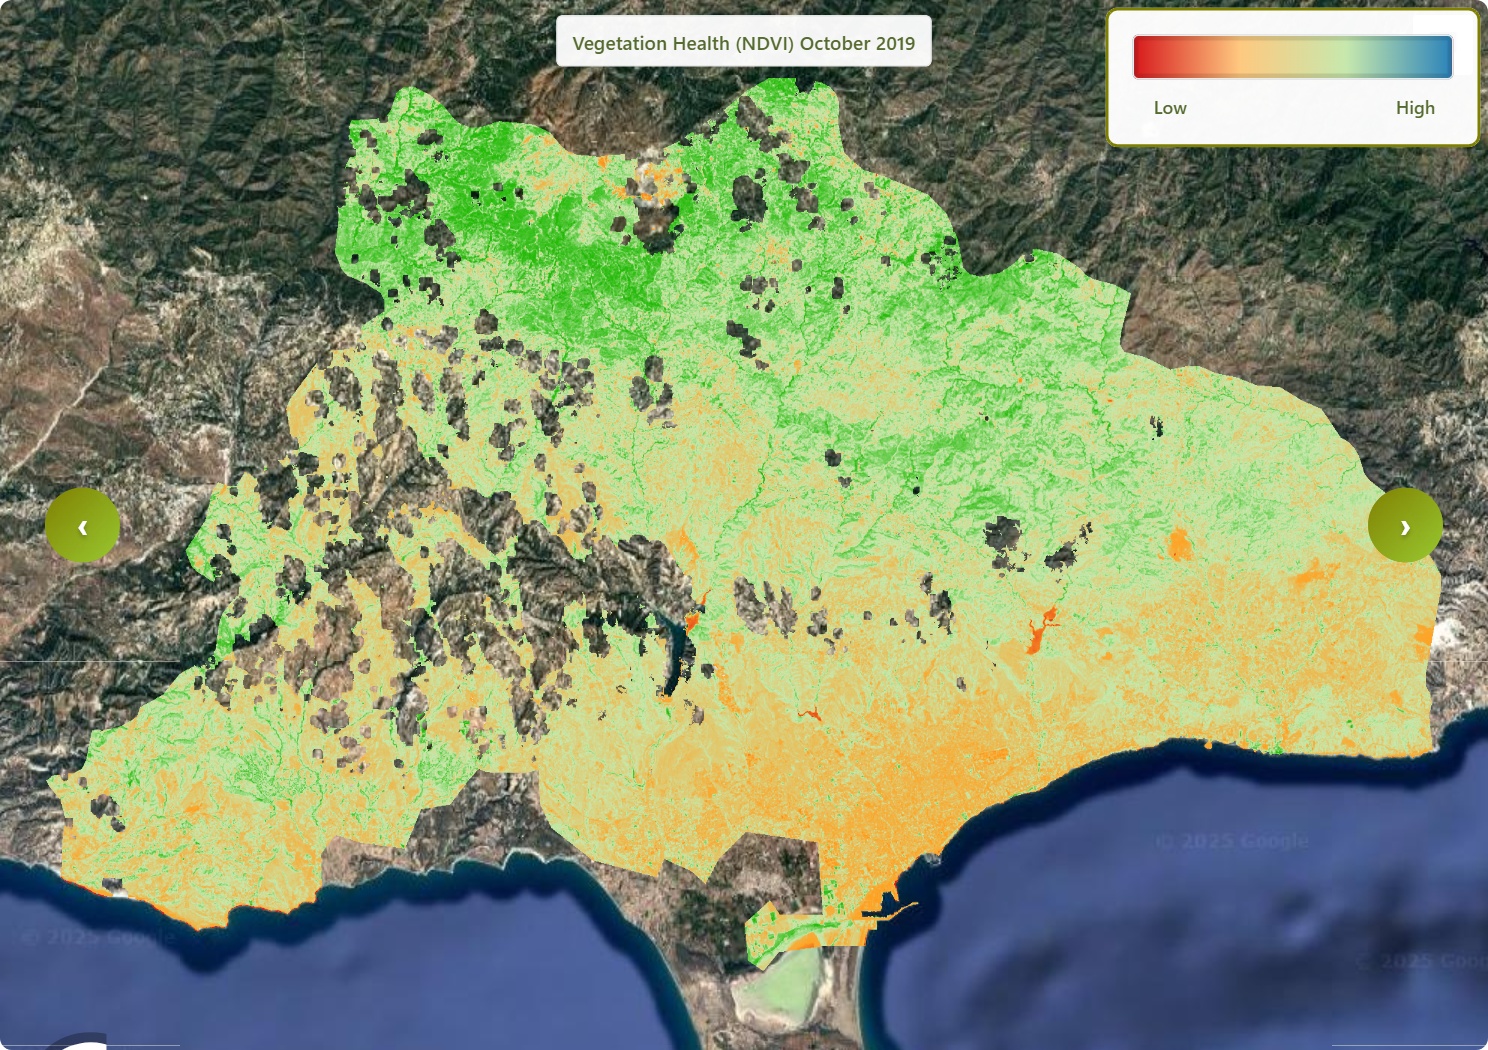
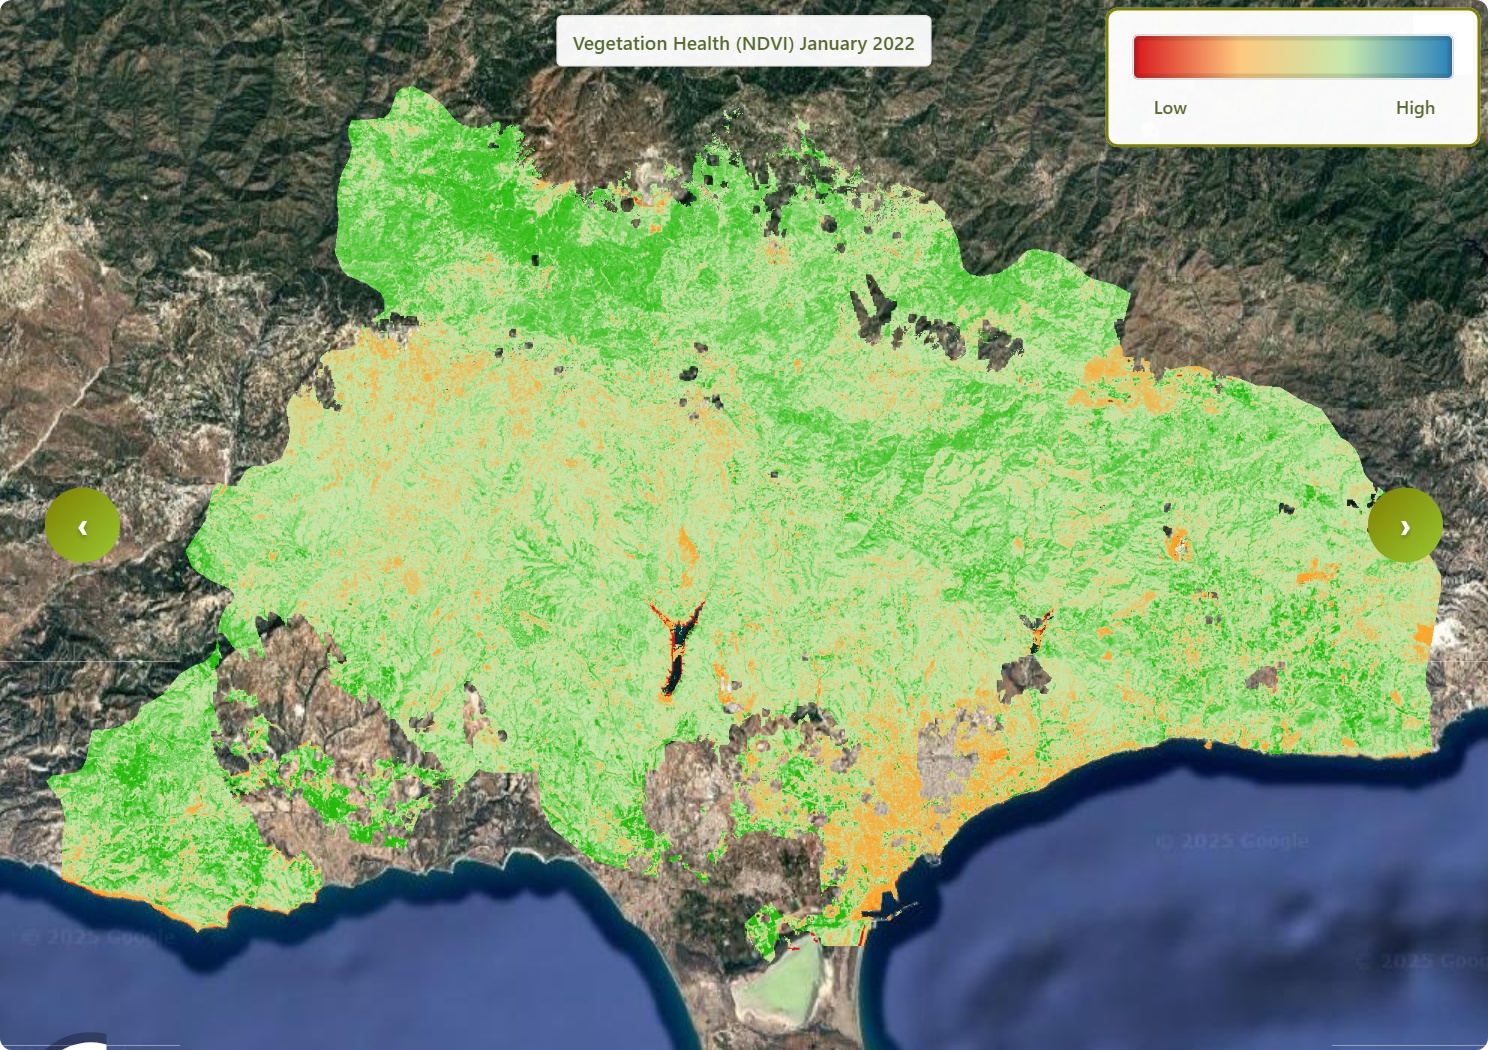
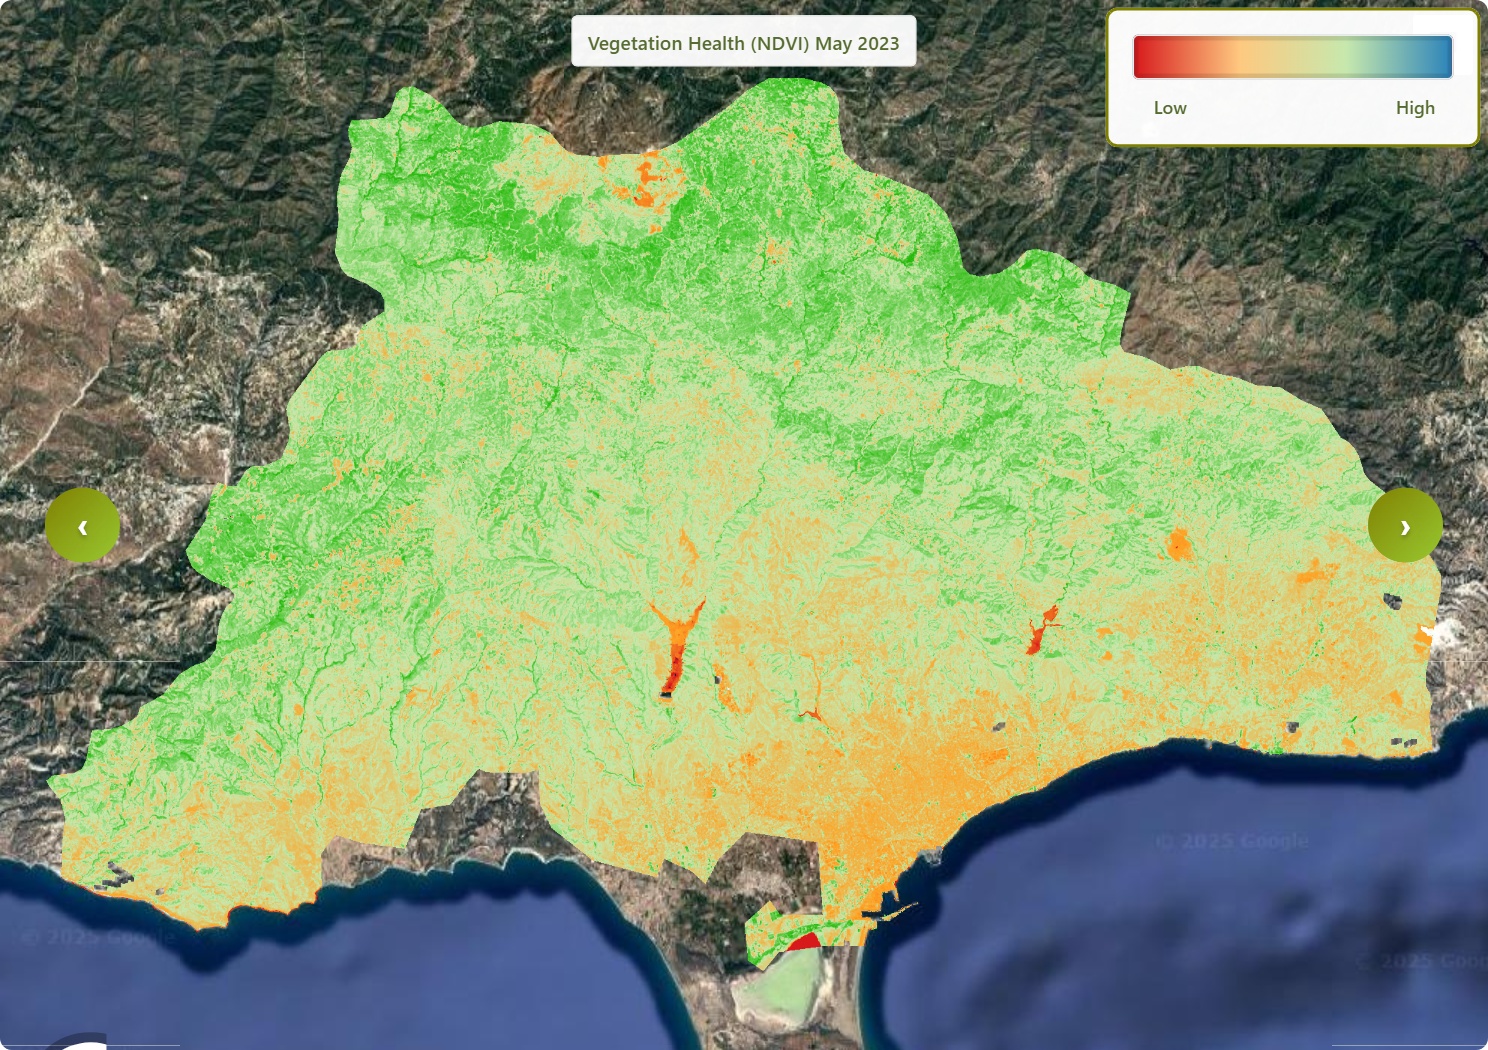
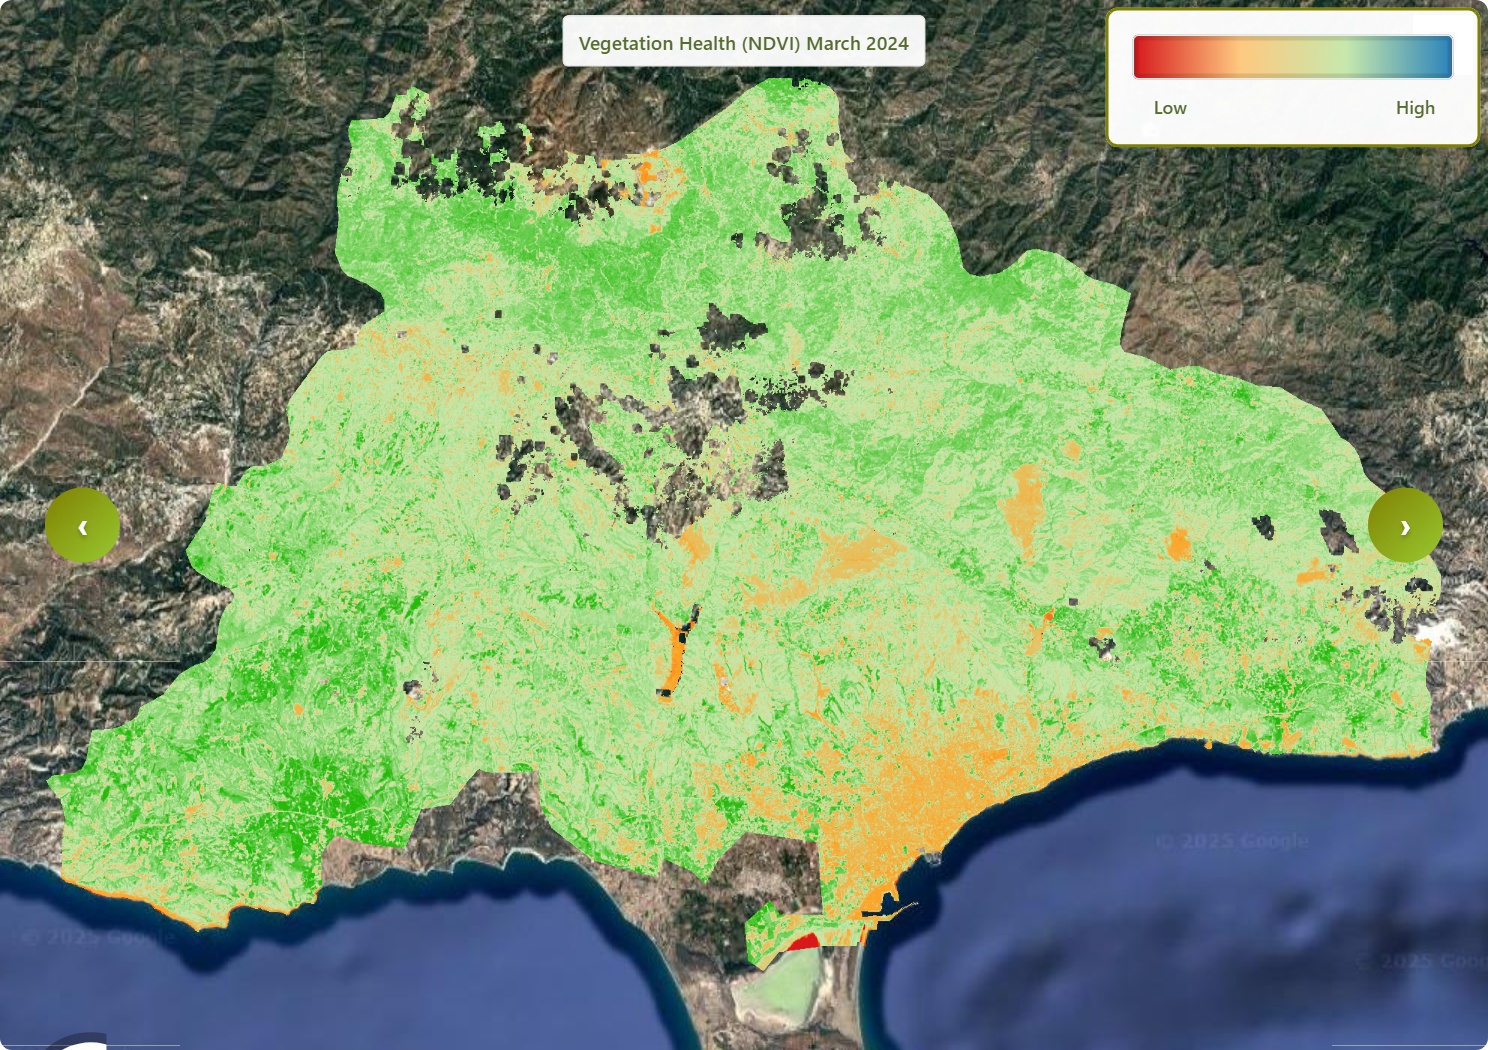
Vegetation Health
Monthly
2015
 |
 |
 |
 |
 |
 |
|
|
 |
 |
 |
 |
|
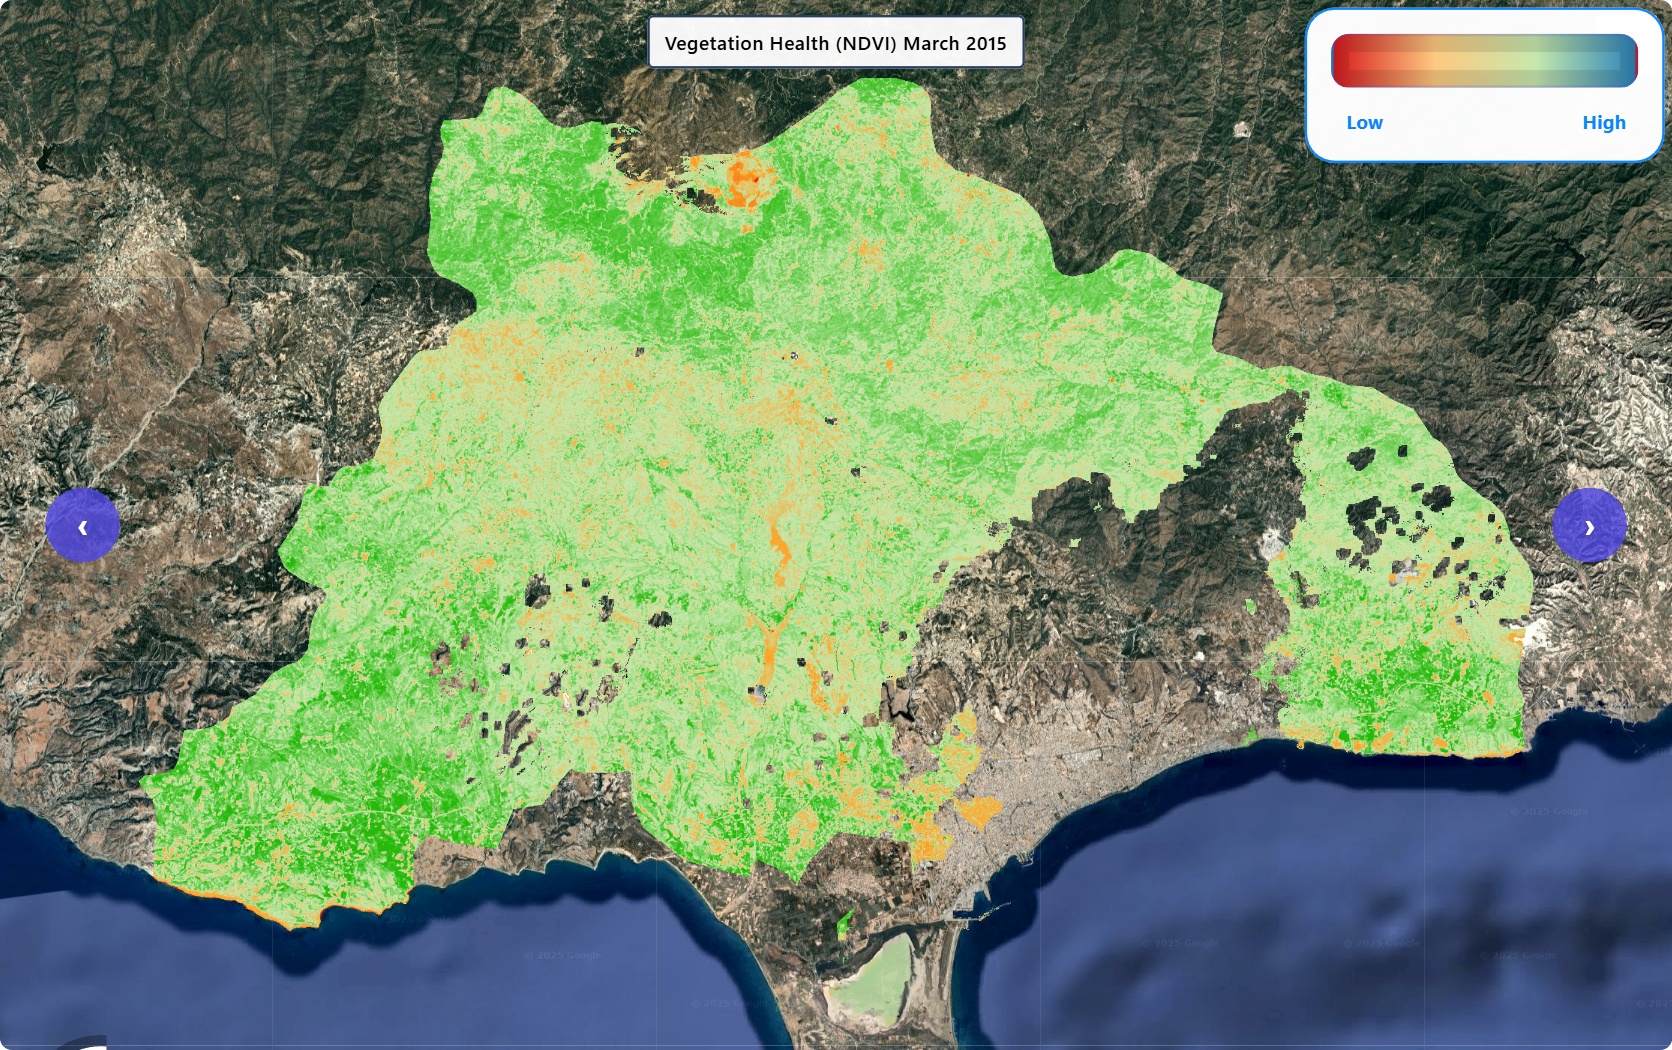
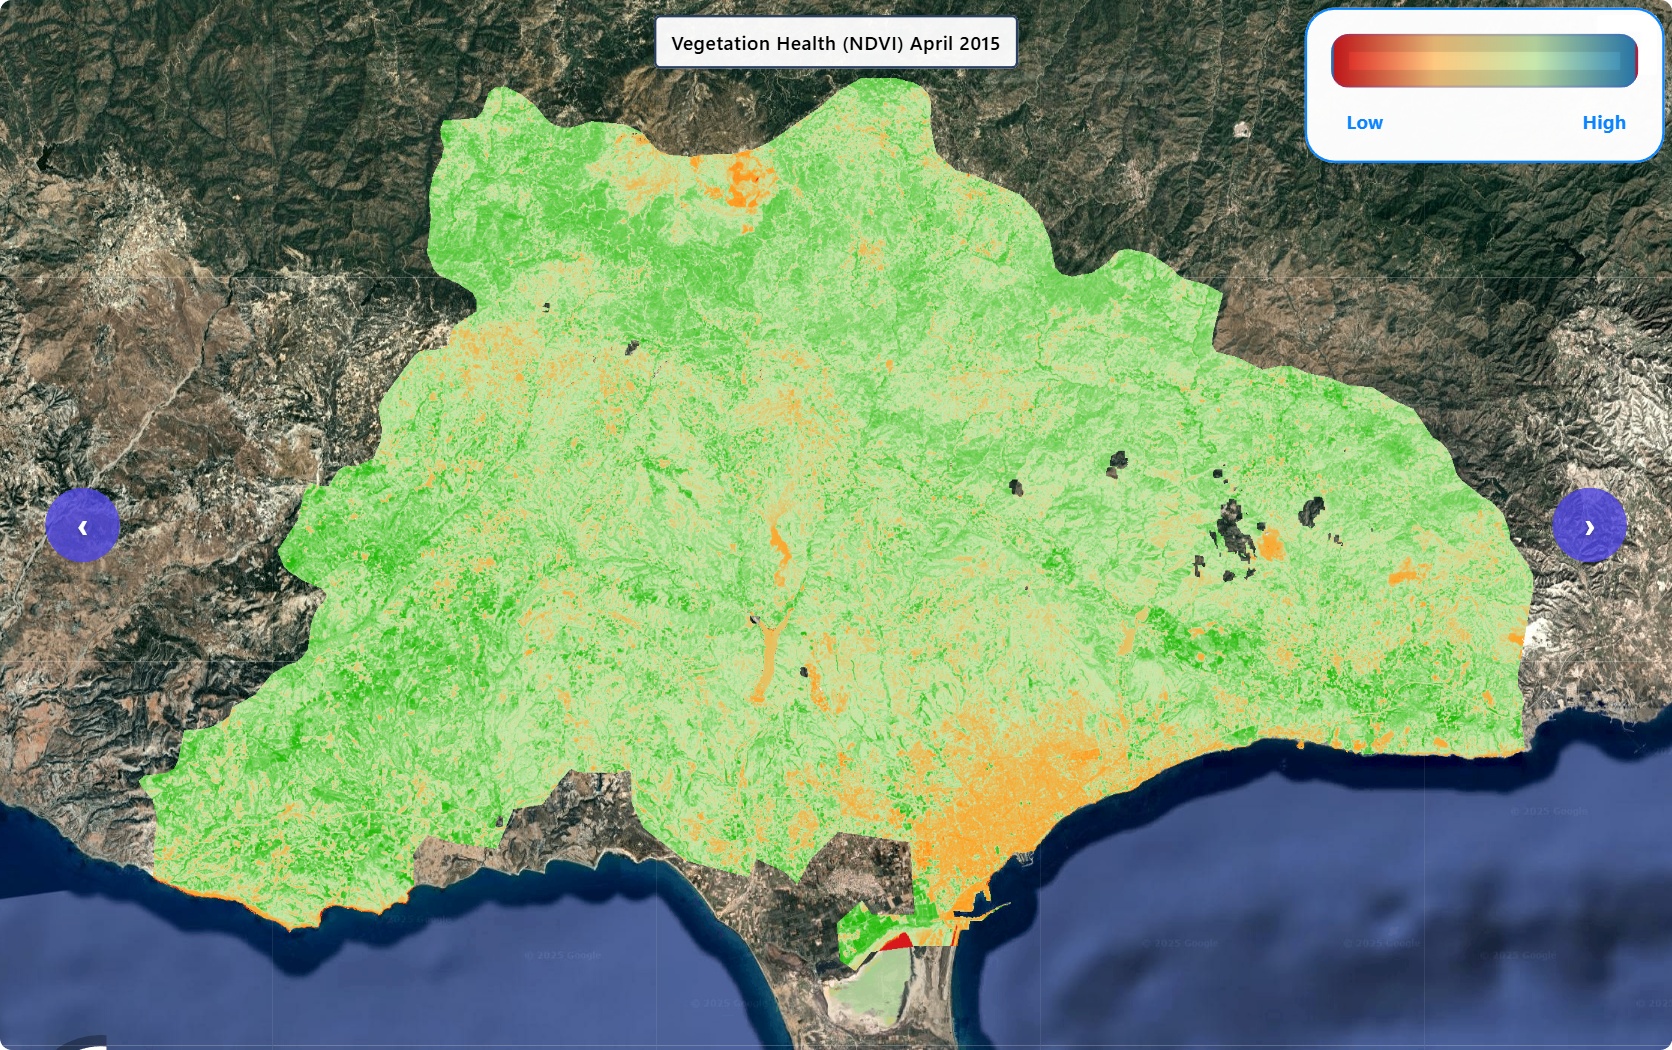
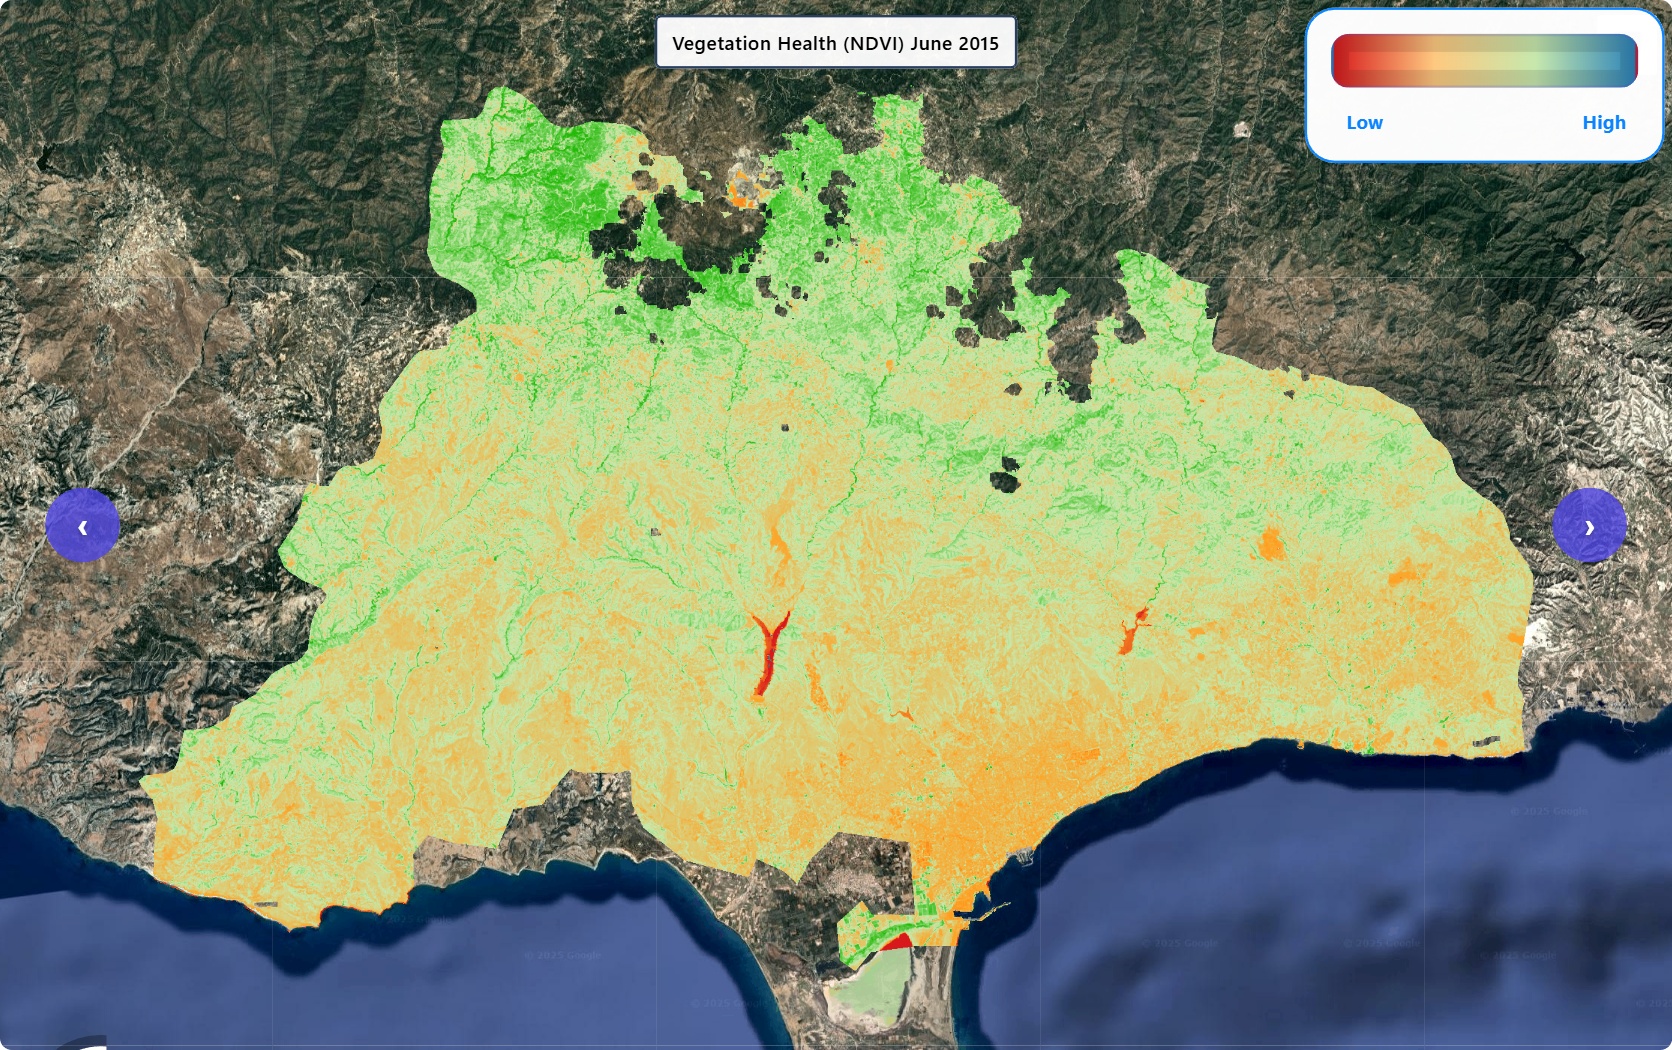
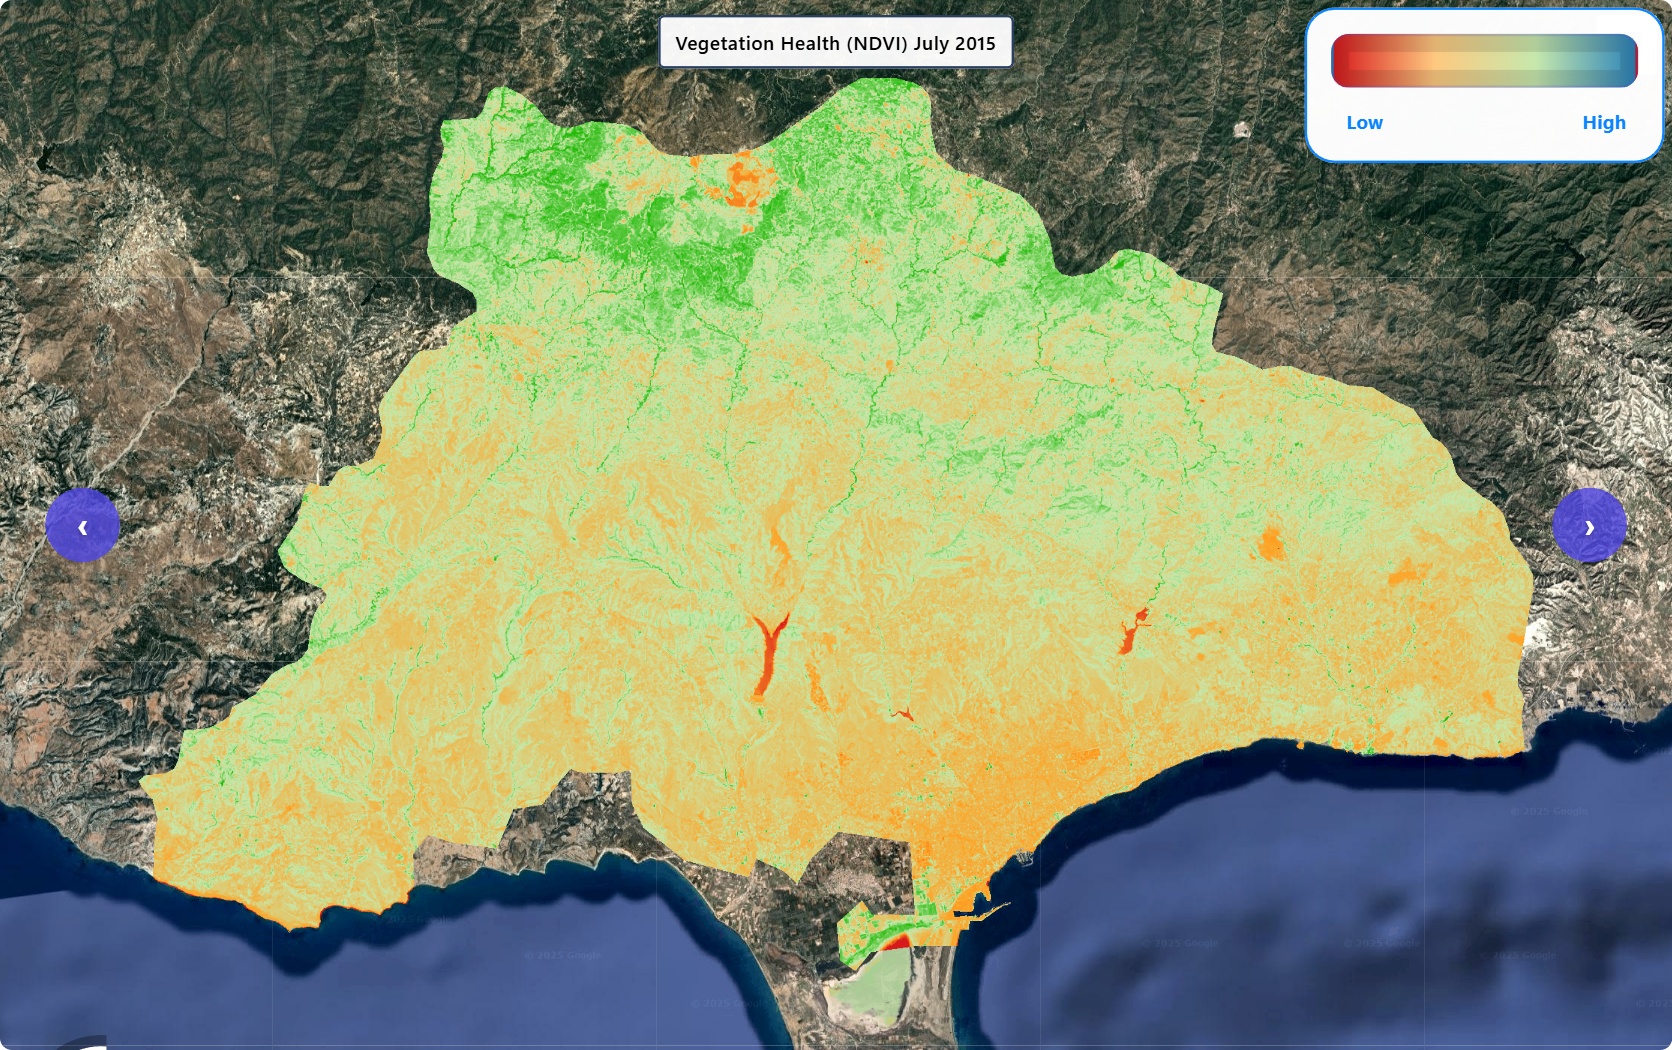
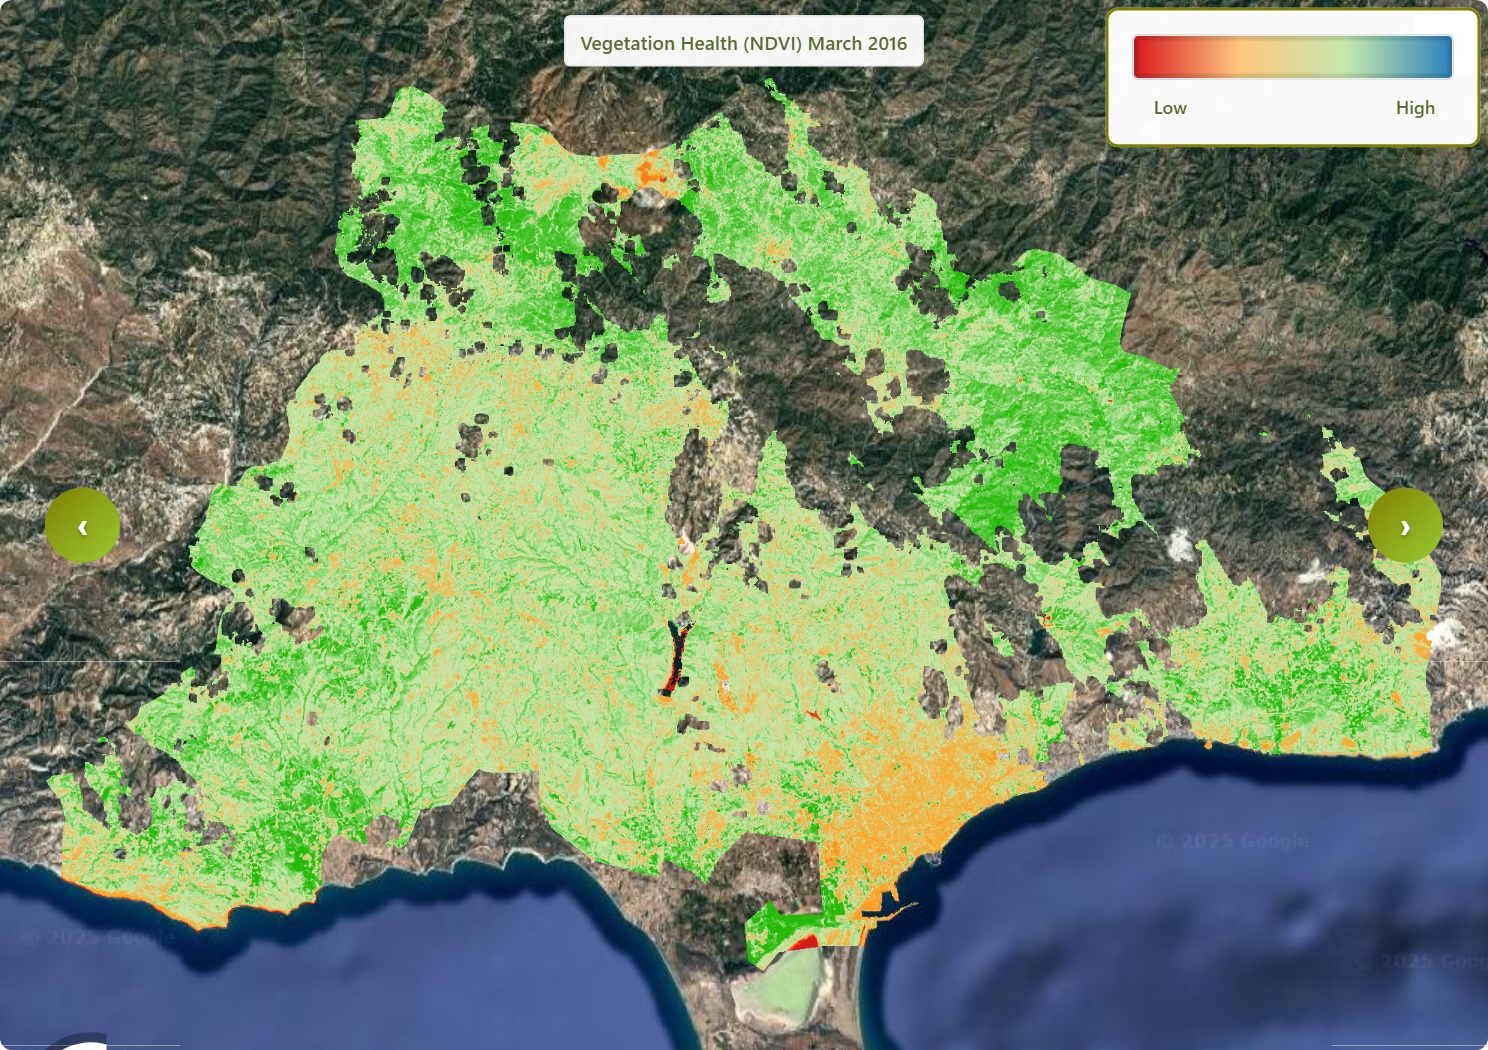
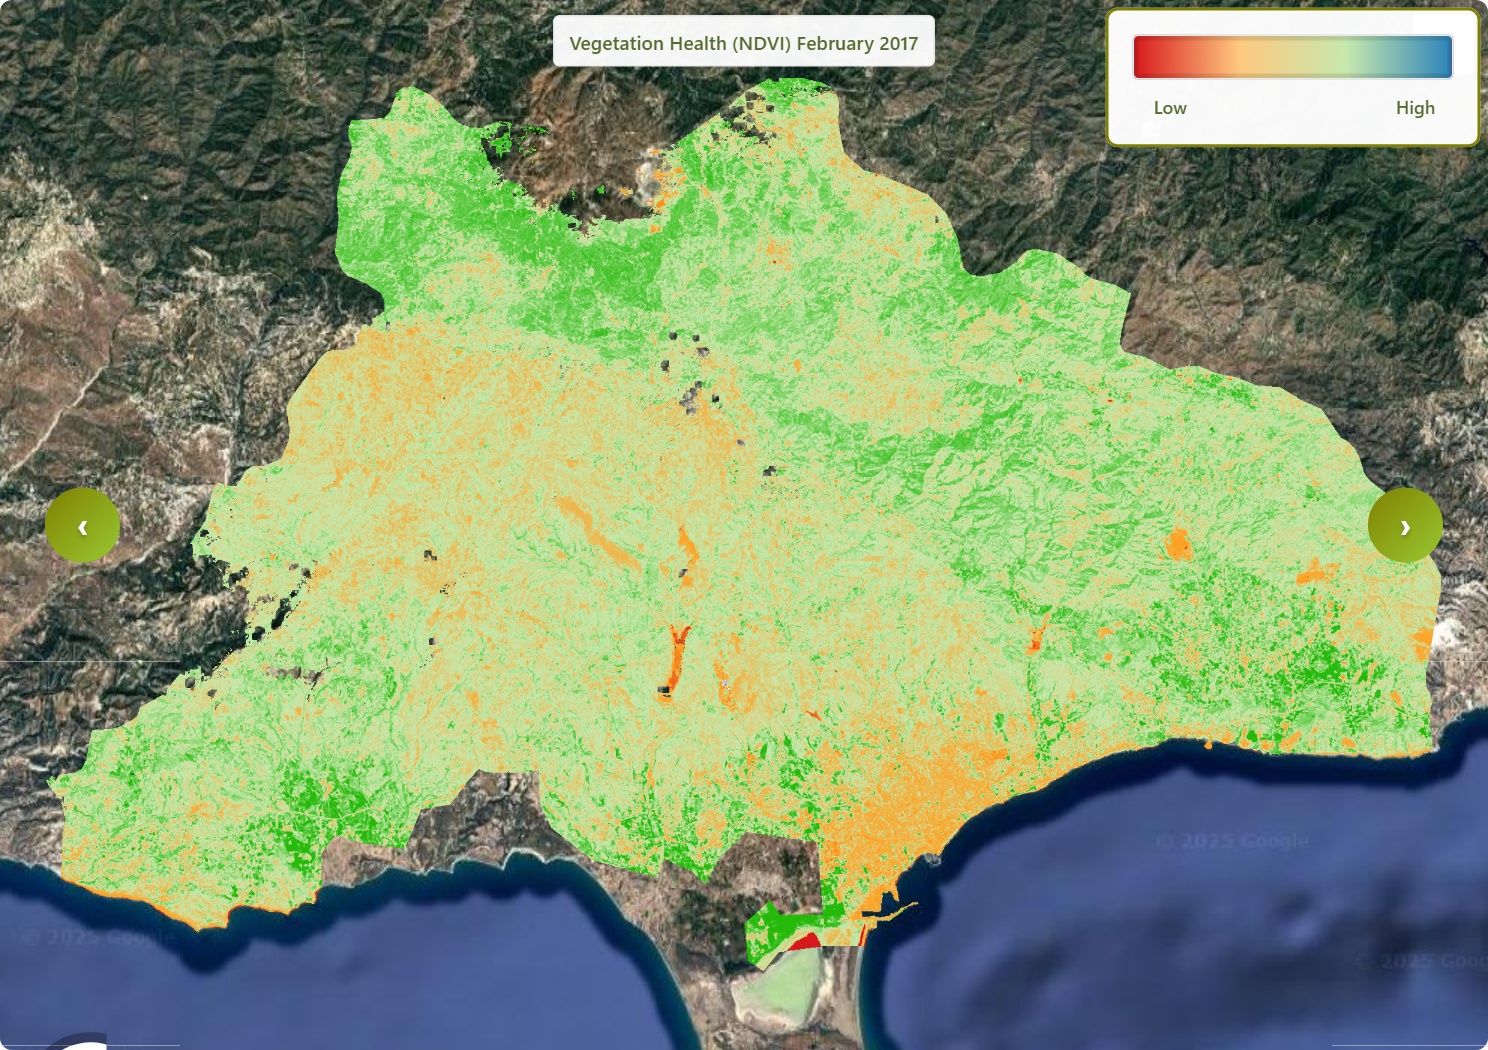
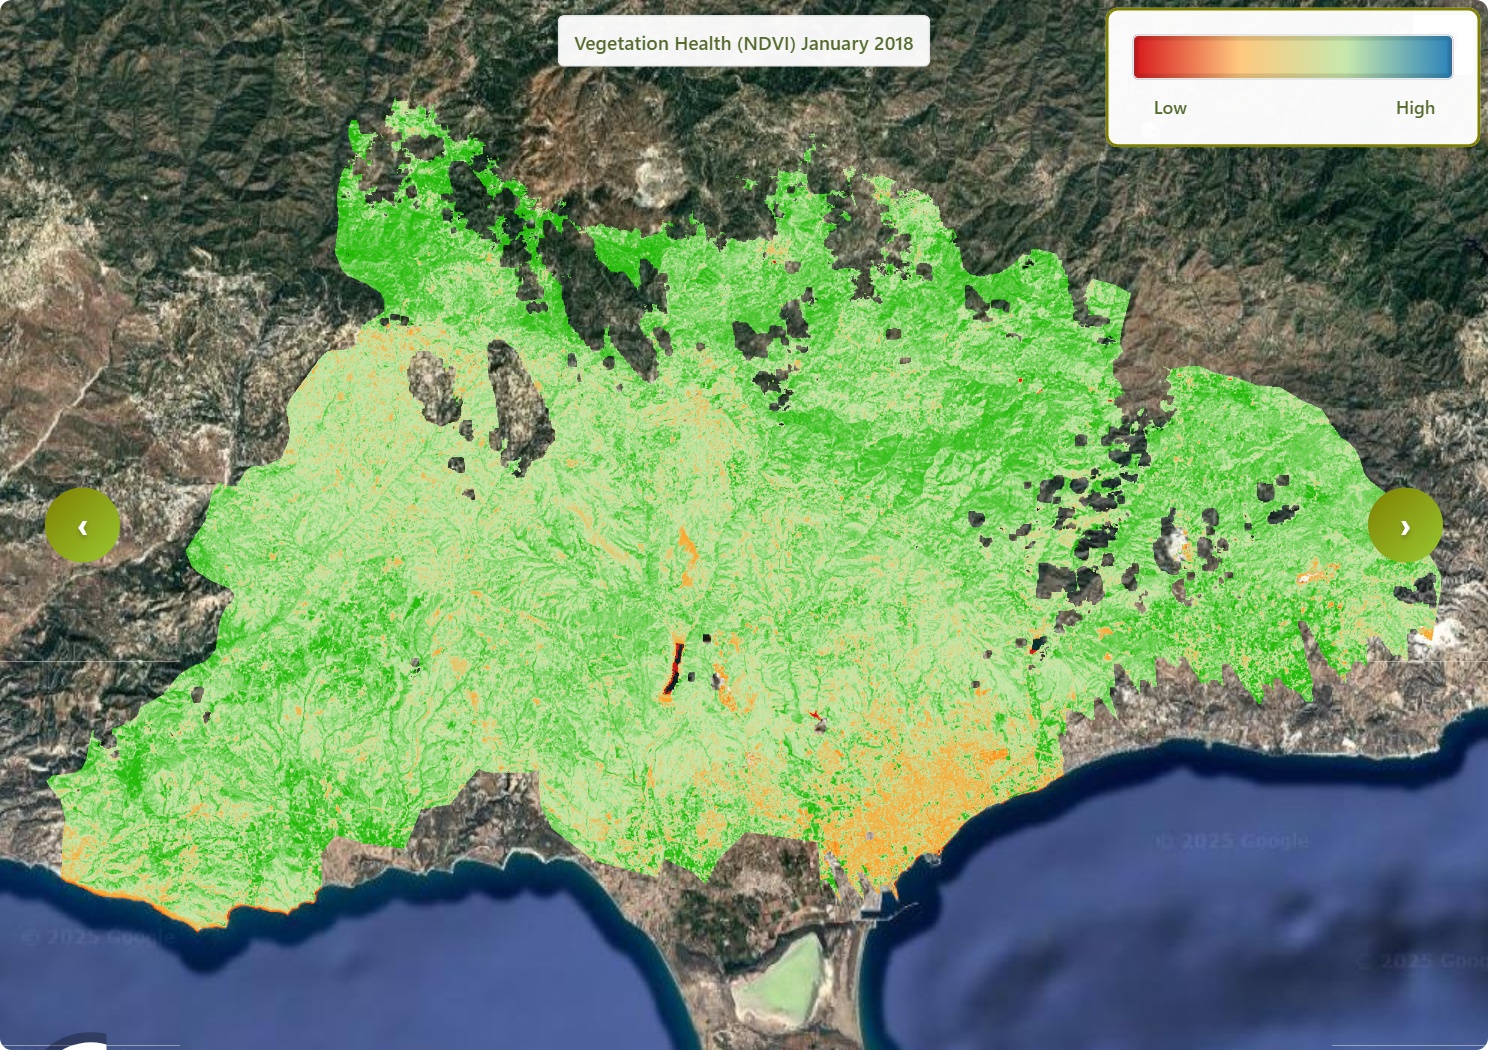
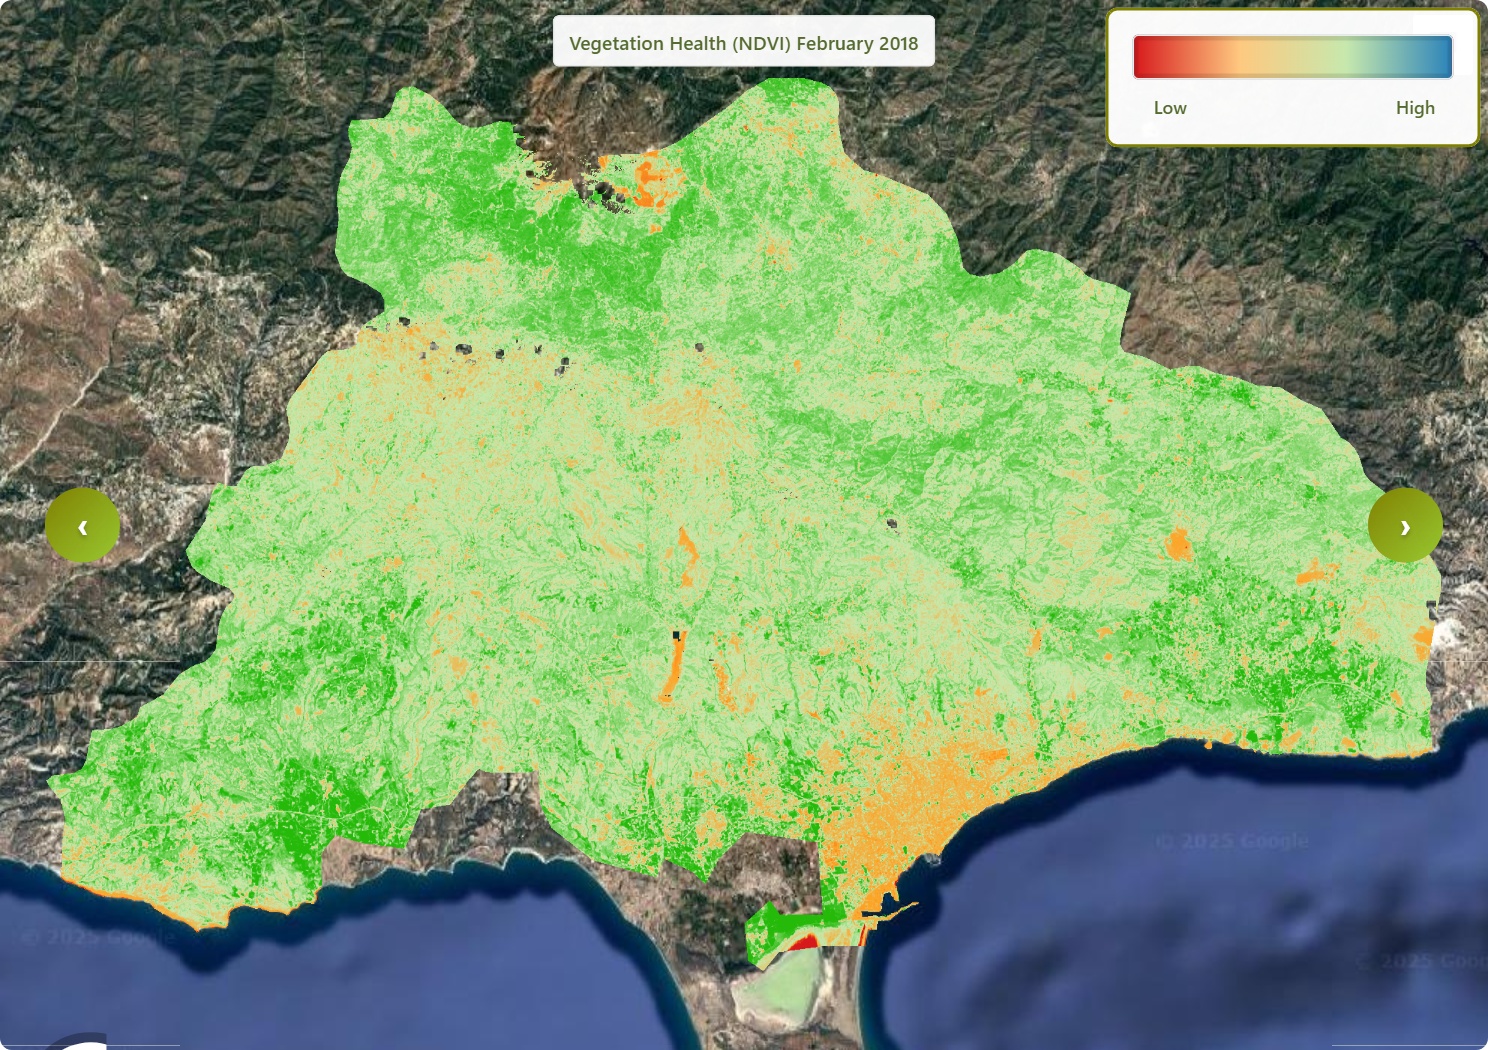
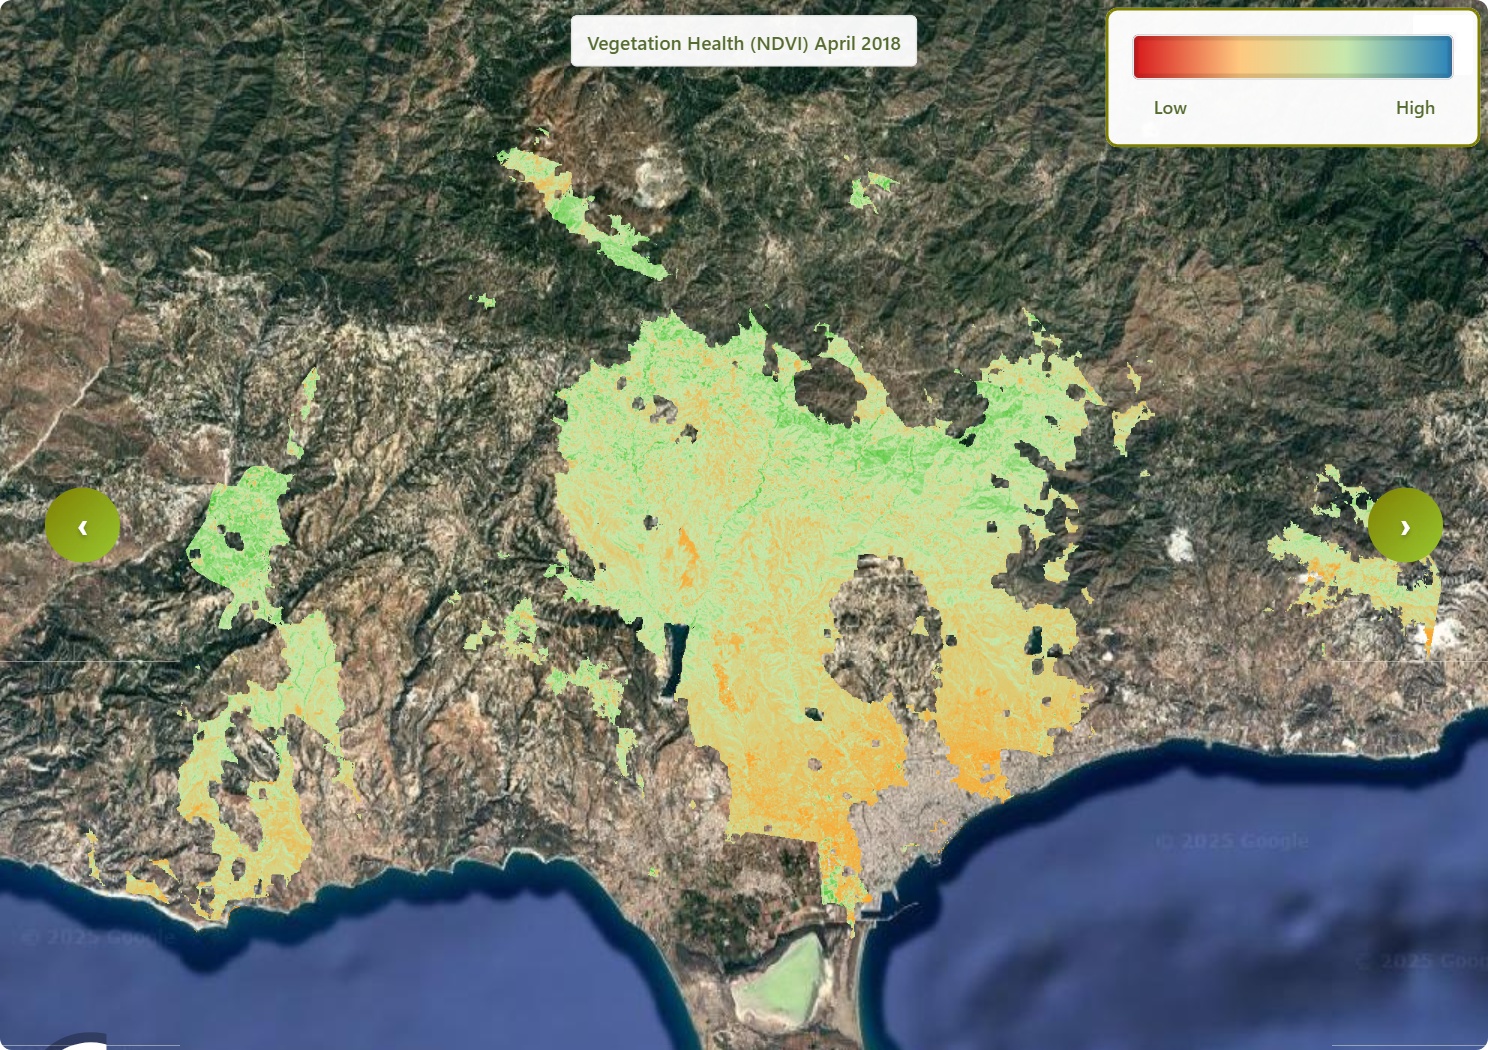
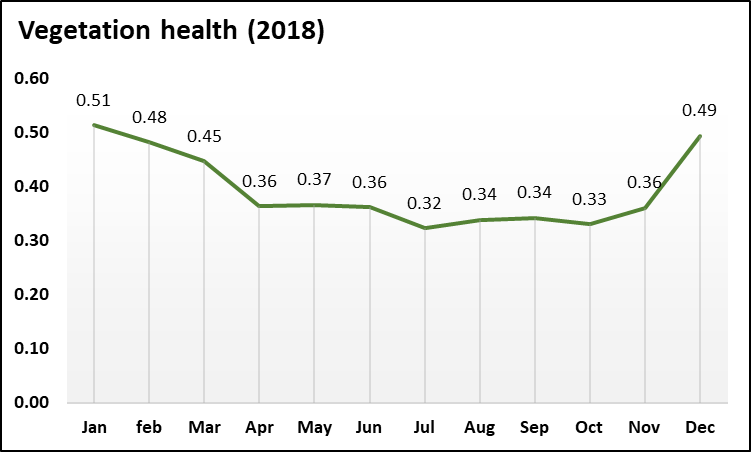
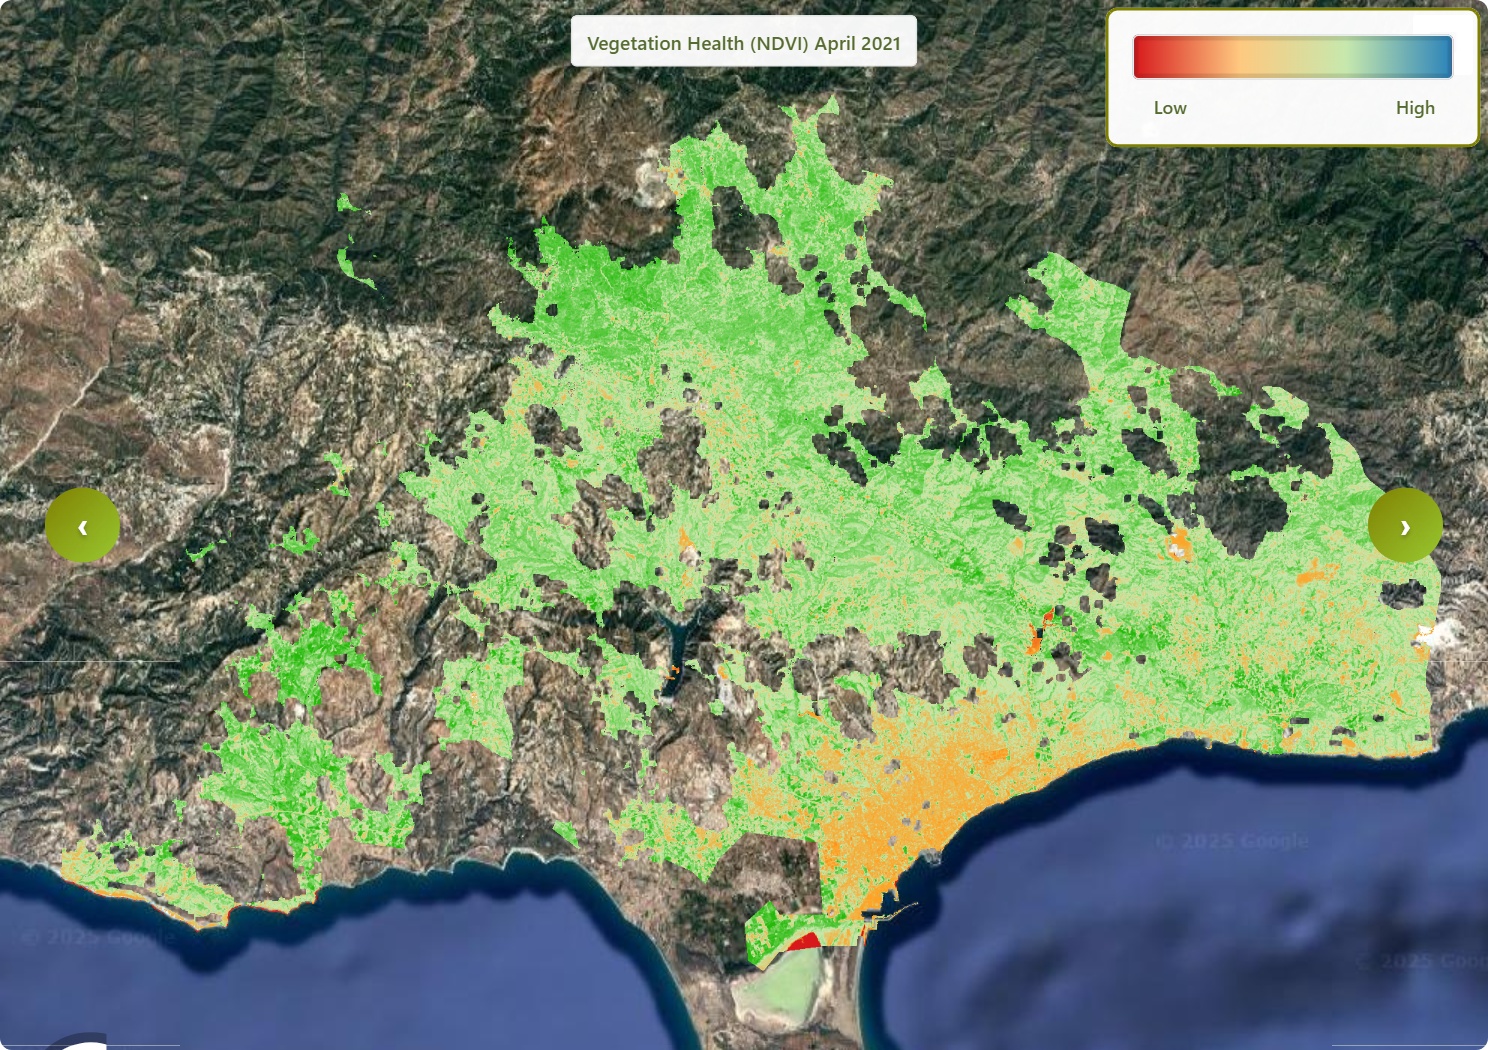
This figure shows the vegetation health of Limassol in 2015(Jan-Dec), using Landsat 8 and 9 satellite datasets.)From January to April, the images are mostly deep green, meaning vegetation is quite healthy and dense across Limassol. From May through September, the green fades, and more pale or brownish patches appear, showing plants becoming drier and stressed during the hot, dry months, with the weakest condition in late summer. From October to December, green areas return and vegetation starts to recover, but overall, it is still slightly less lush than at the start of the year.

Vegetation in Limassol started in 2015 in quite good condition, with the highest value in January. From February onwards, it slowly became weaker, reaching its lowest point in September, likely reflecting the hot, dry summer period. After September, vegetation gradually recovered, improving again in October and November, but it did not fully return to the strong levels seen at the beginning of the year.
2016
 |
 |
 |
 |
 |
 |
 |
 |
 |
 |
 |
 |
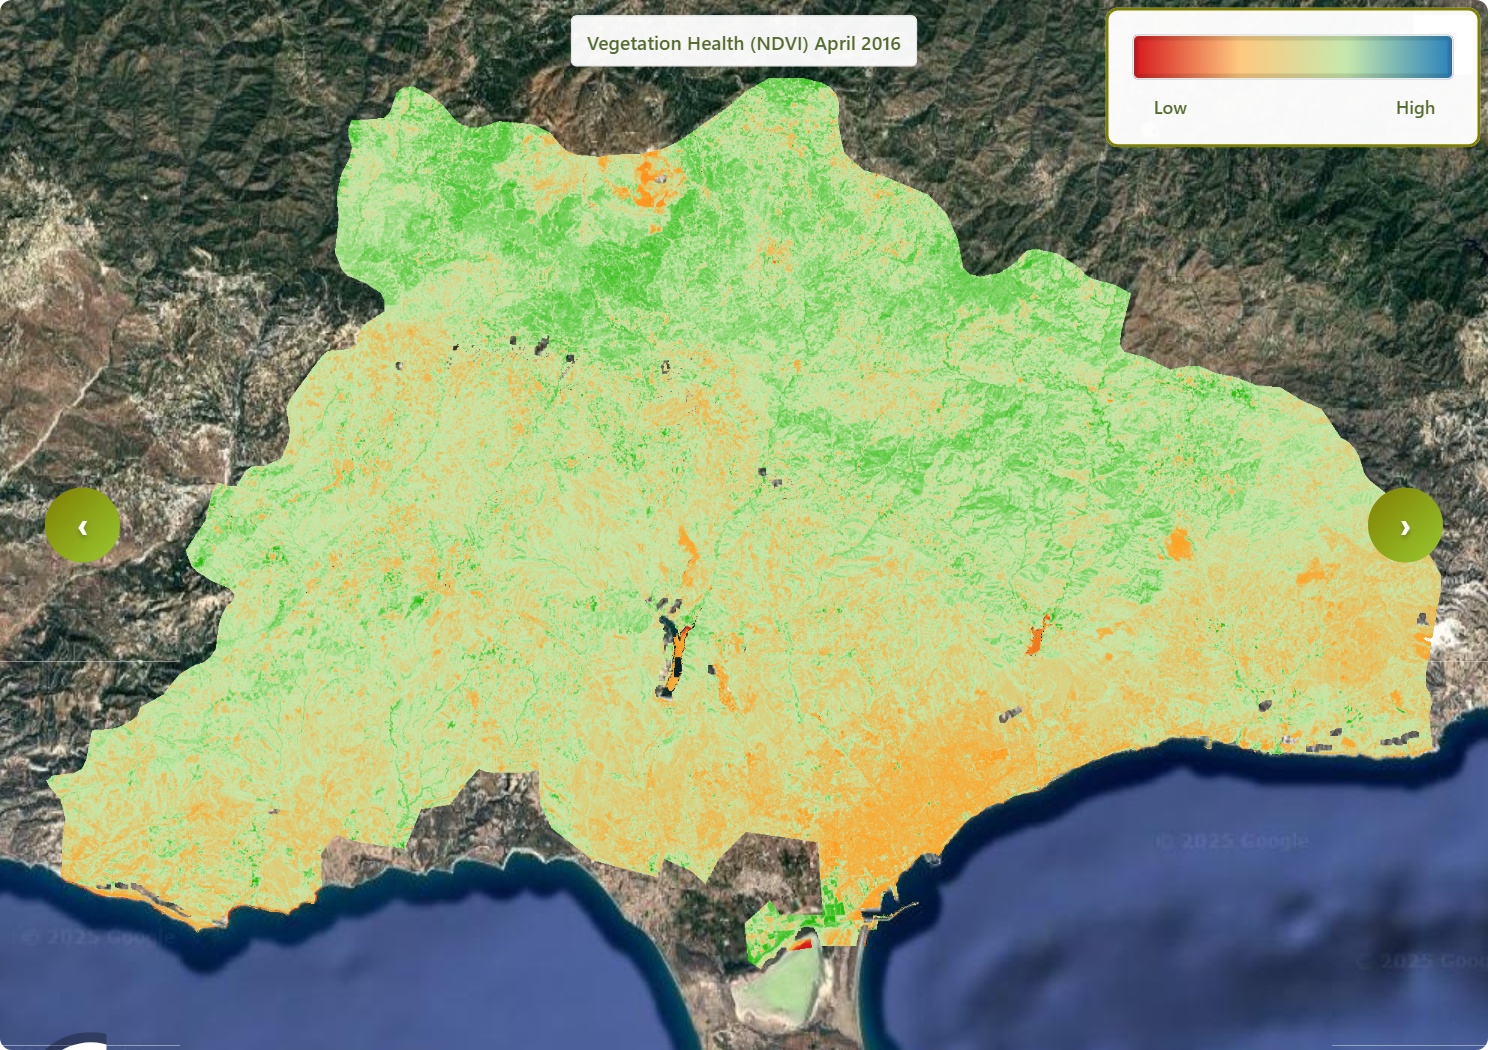
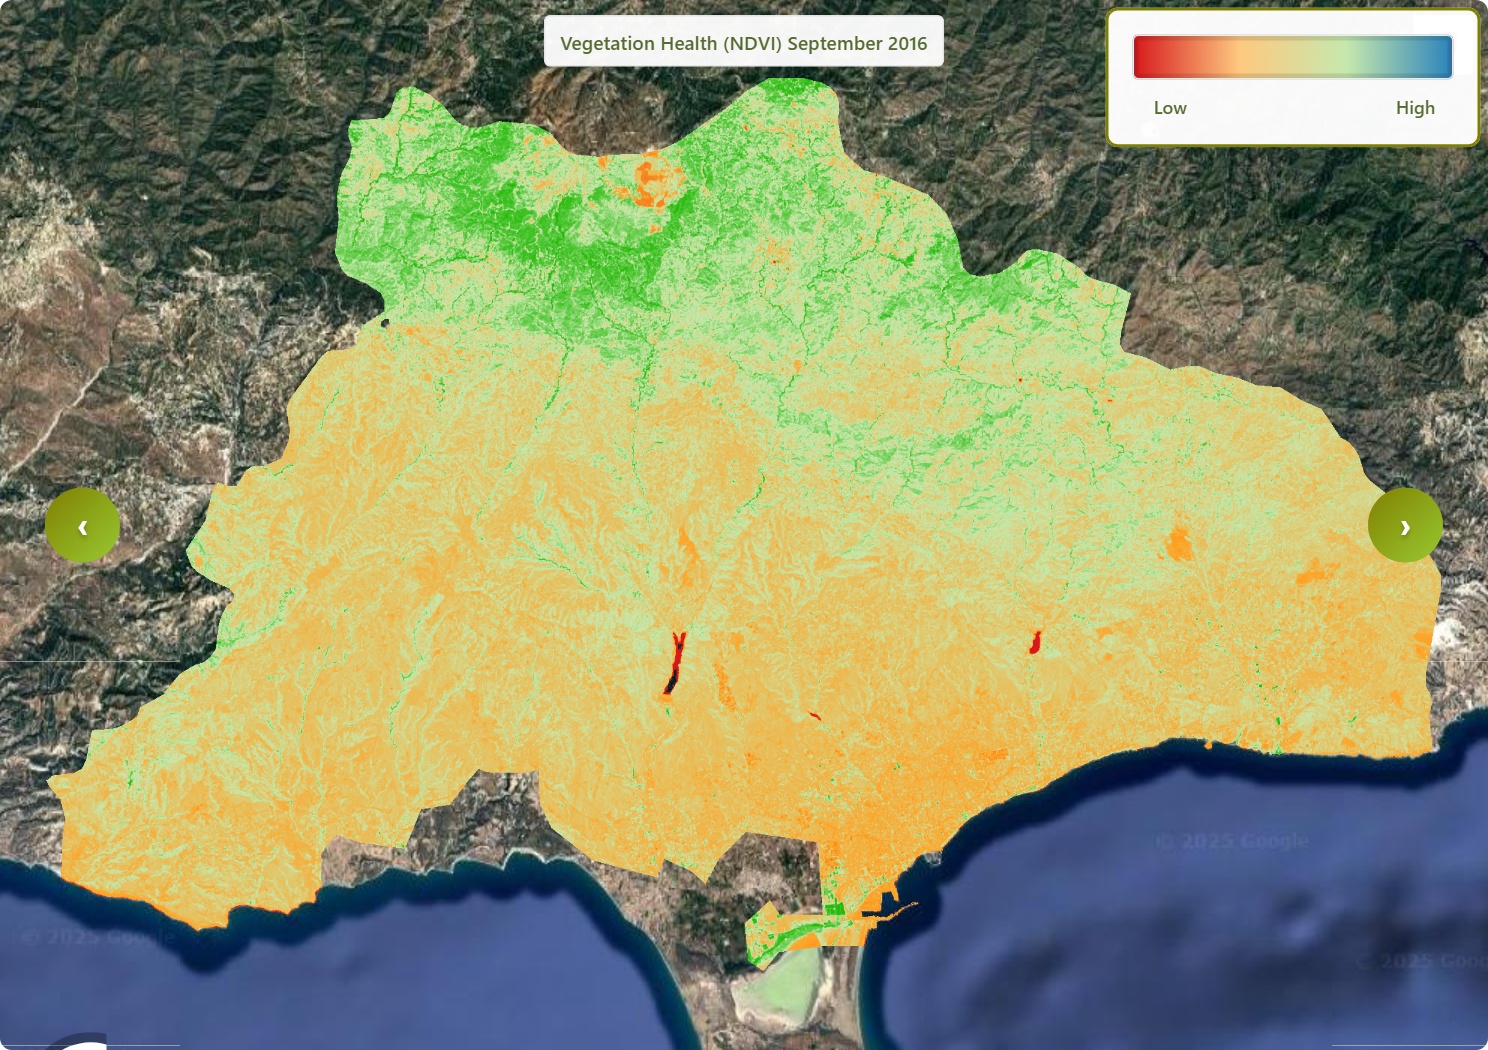
In the first few months, the images show more intense green tones, meaning plants and forests are relatively healthy. From late spring through summer, the green becomes duller and more patchy, showing drier and more stressed vegetation that remains weak for many months. Towards November and December, some green returns, but overall, the landscape still looks less lush than in the early part of the year.
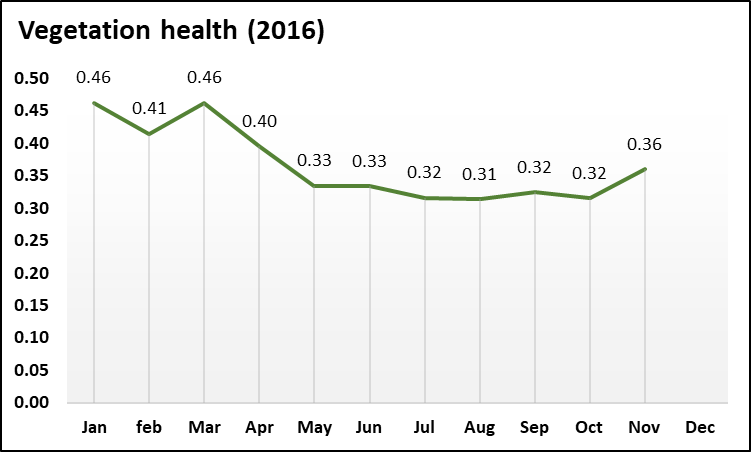
Vegetation starts the year in fairly good condition, with the best values in January and March. From April and especially May onwards, plant health drops and then stays mostly low and flat through the summer and early autumn. There is a small improvement in November and December, but vegetation does not return to the stronger levels seen at the beginning of the year.
2017
 |
 |
 |
 |
 |
 |
 |
 |
 |
 |
 |
 |
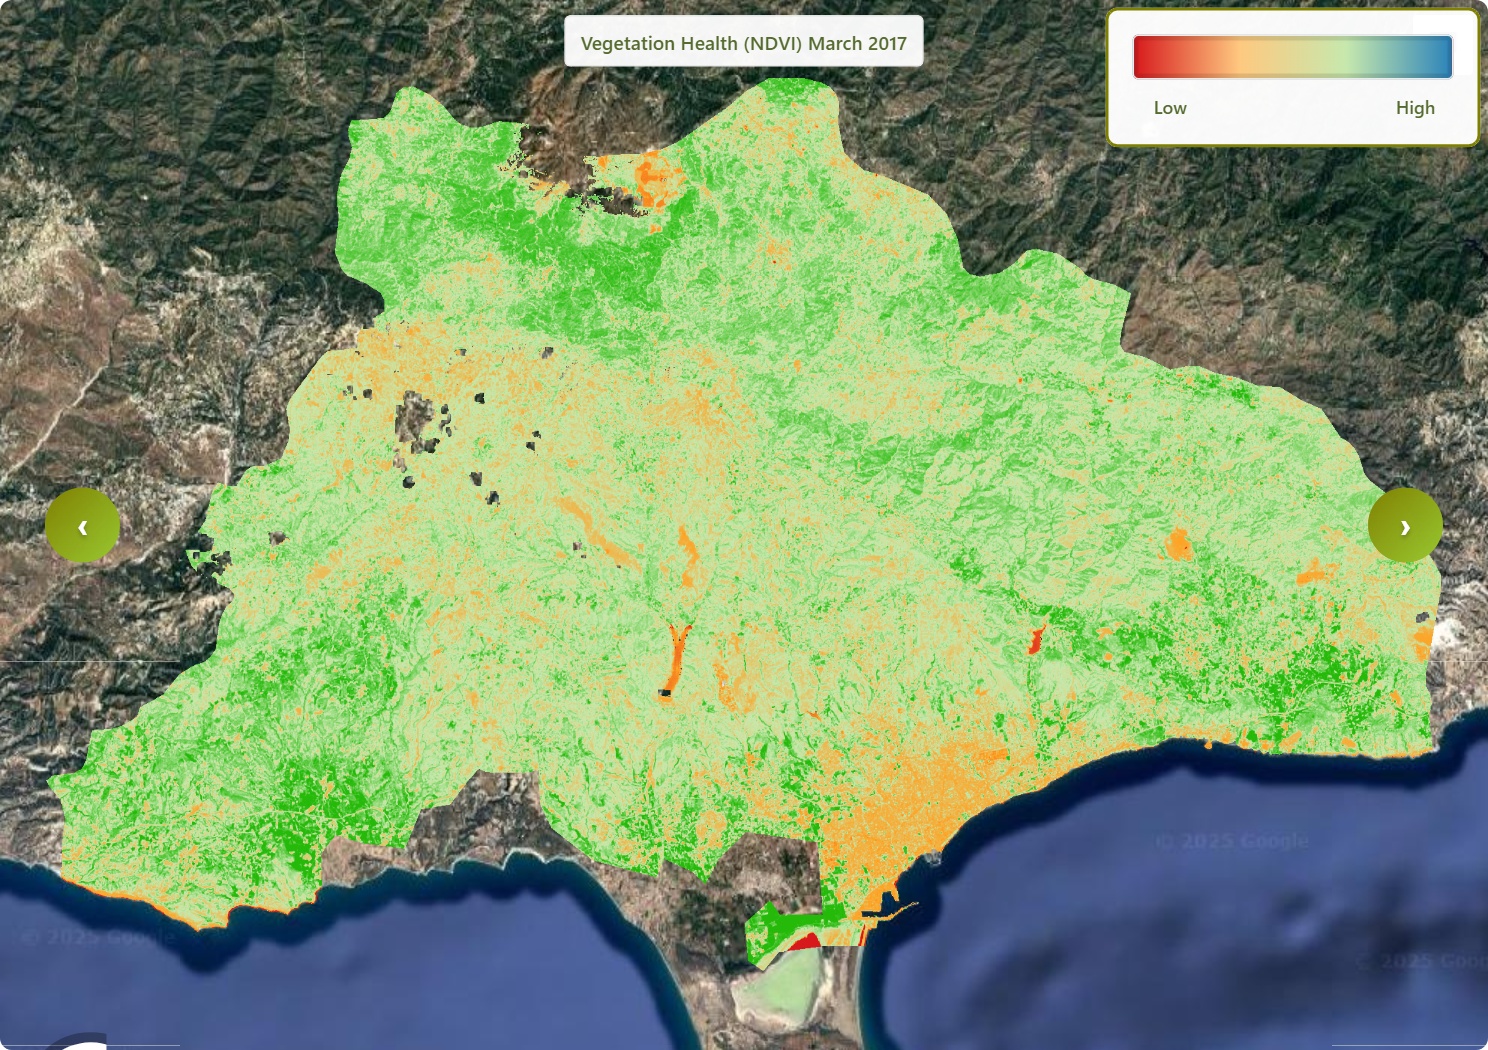
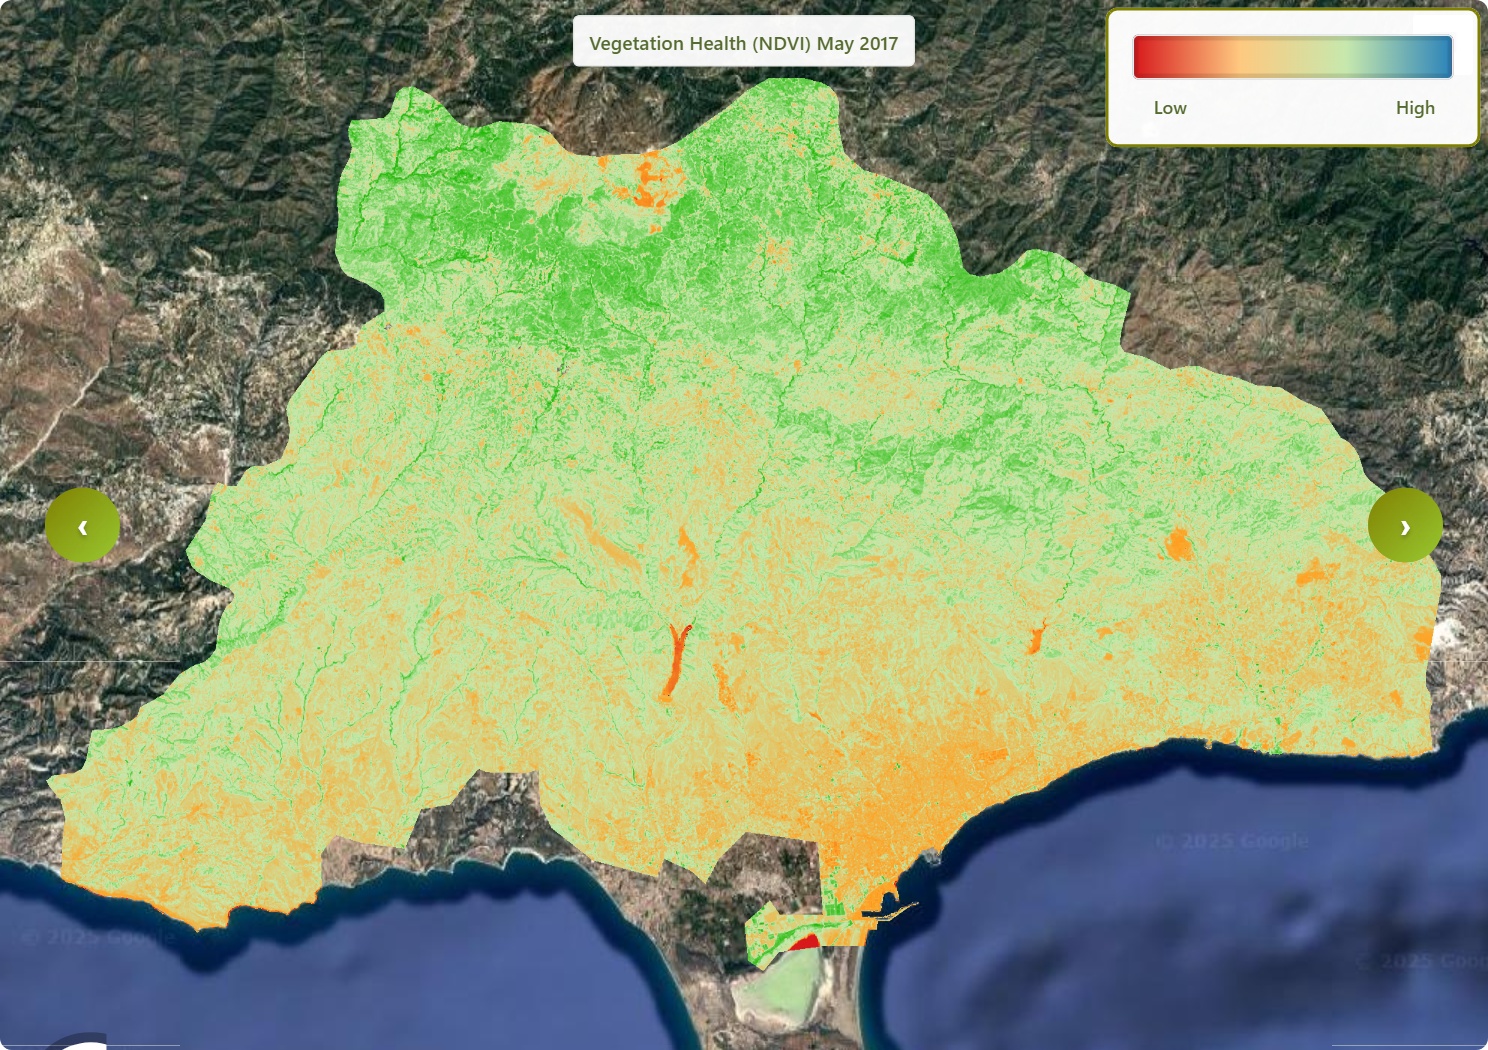
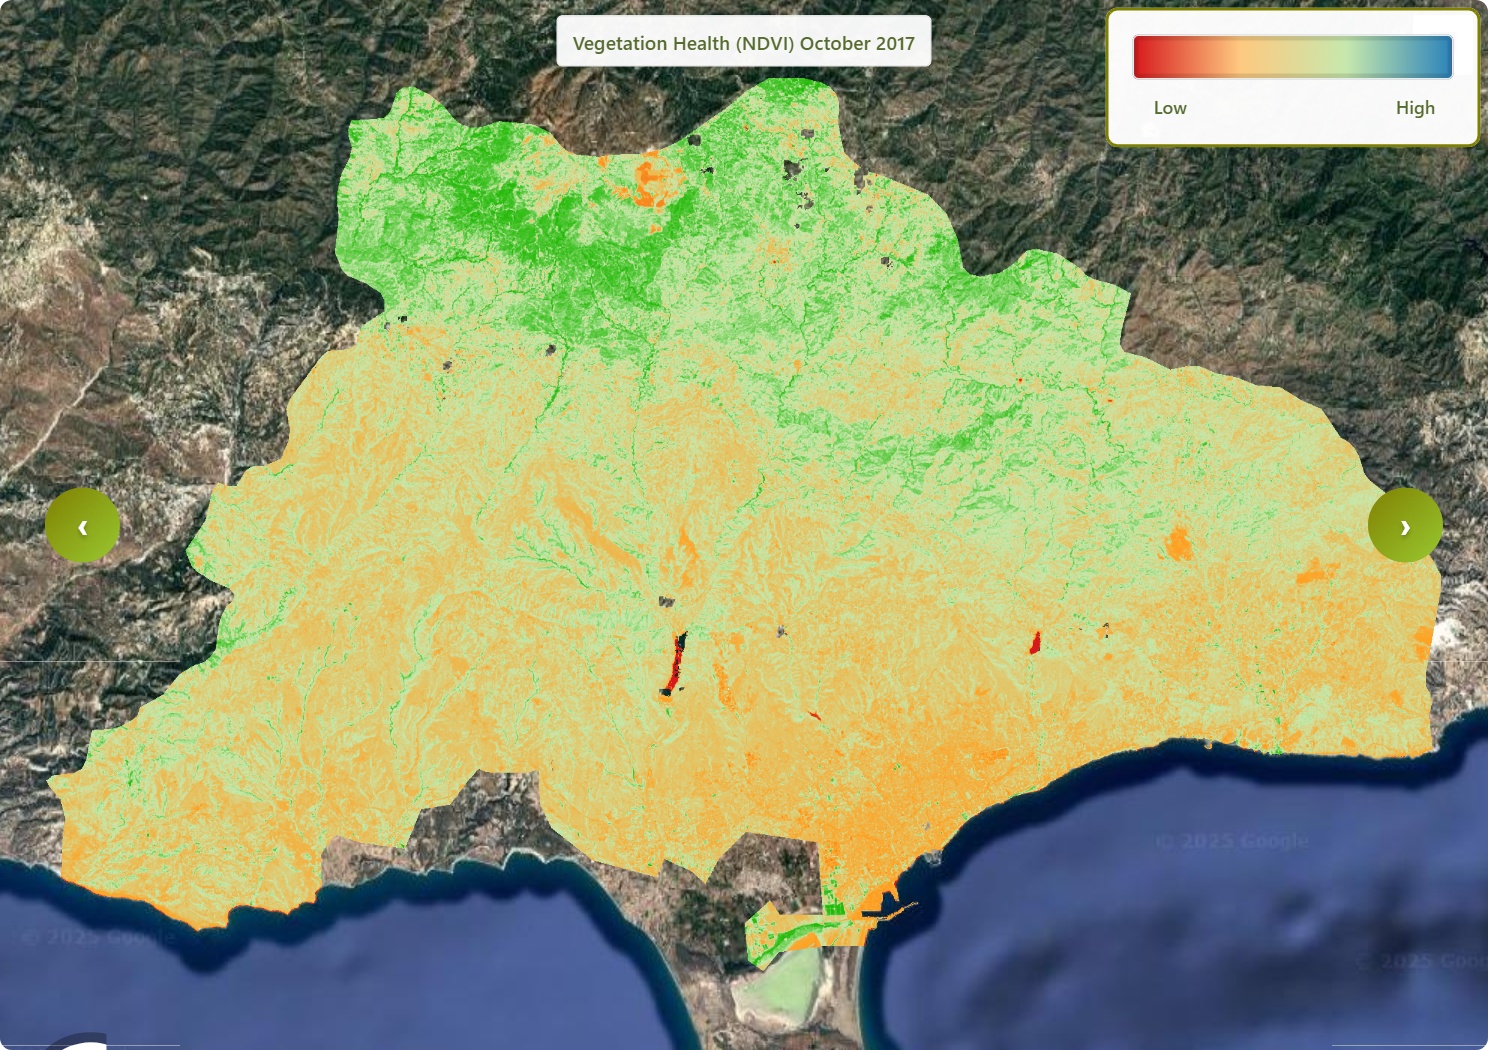
This figure shows the vegetation health of Limassol in 2015(Jan-Dec).In the images for January to April, most areas appear clearly green, showing healthy and dense vegetation. From May through September, the green tones fade, and more dull or brownish patches appear, meaning plants are drier and more stressed in the hot months. From October to December, green areas spread again, indicating the recovery of vegetation towards the end of the year.
Vegetation starts the year in fairly good condition and stays strong up to April. From May to September, plant health gradually weakens and reaches its lowest point in late summer. After September, vegetation steadily improves again, ending the year in December with much better health than in mid-year.
2018
 |
 |
 |
 |
 |
 |
 |
 |
 |
 |
|
 |
This figure shows the vegetation health of Limassol in 2015(Jan-Dec).In the early months, the images show deep green tones across much of Limassol, meaning vegetation is lush and strong. As spring turns into summer, the green fades, and more pale or brownish patches appear, showing plants becoming drier and stressed. Towards the end of the year, especially in November and December, green areas spread again, indicating that vegetation recovers and becomes much healthier.
Vegetation is very healthy at the start of 2018, especially in January and February. From March to July, plant health steadily drops and stays quite weak through late summer and early autumn. From November to December, there is a strong recovery, and vegetation ends the year in very good condition again.
2019
 |
 |
 |
 |
 |
 |
 |
 |
 |
 |
 |
In the images for the first few months, large parts of Limassol appear green, showing generally healthy vegetation. During late spring and summer, the green tones fade slightly, and some areas look drier, but not severely damaged. From autumn into December, the green becomes stronger and more widespread again, indicating that plants recover well and end the year in very good condition.

Vegetation starts the year in moderate condition and quickly improves, with the best early values in February and March. Plant health drops during late spring and early summer, then stays fairly steady through the hot months. From October onward, there is a clear improvement, and December shows the strongest vegetation of the whole year.
2020
 |
 |
 |
 |
 |
 |
 |
 |
 |
 |
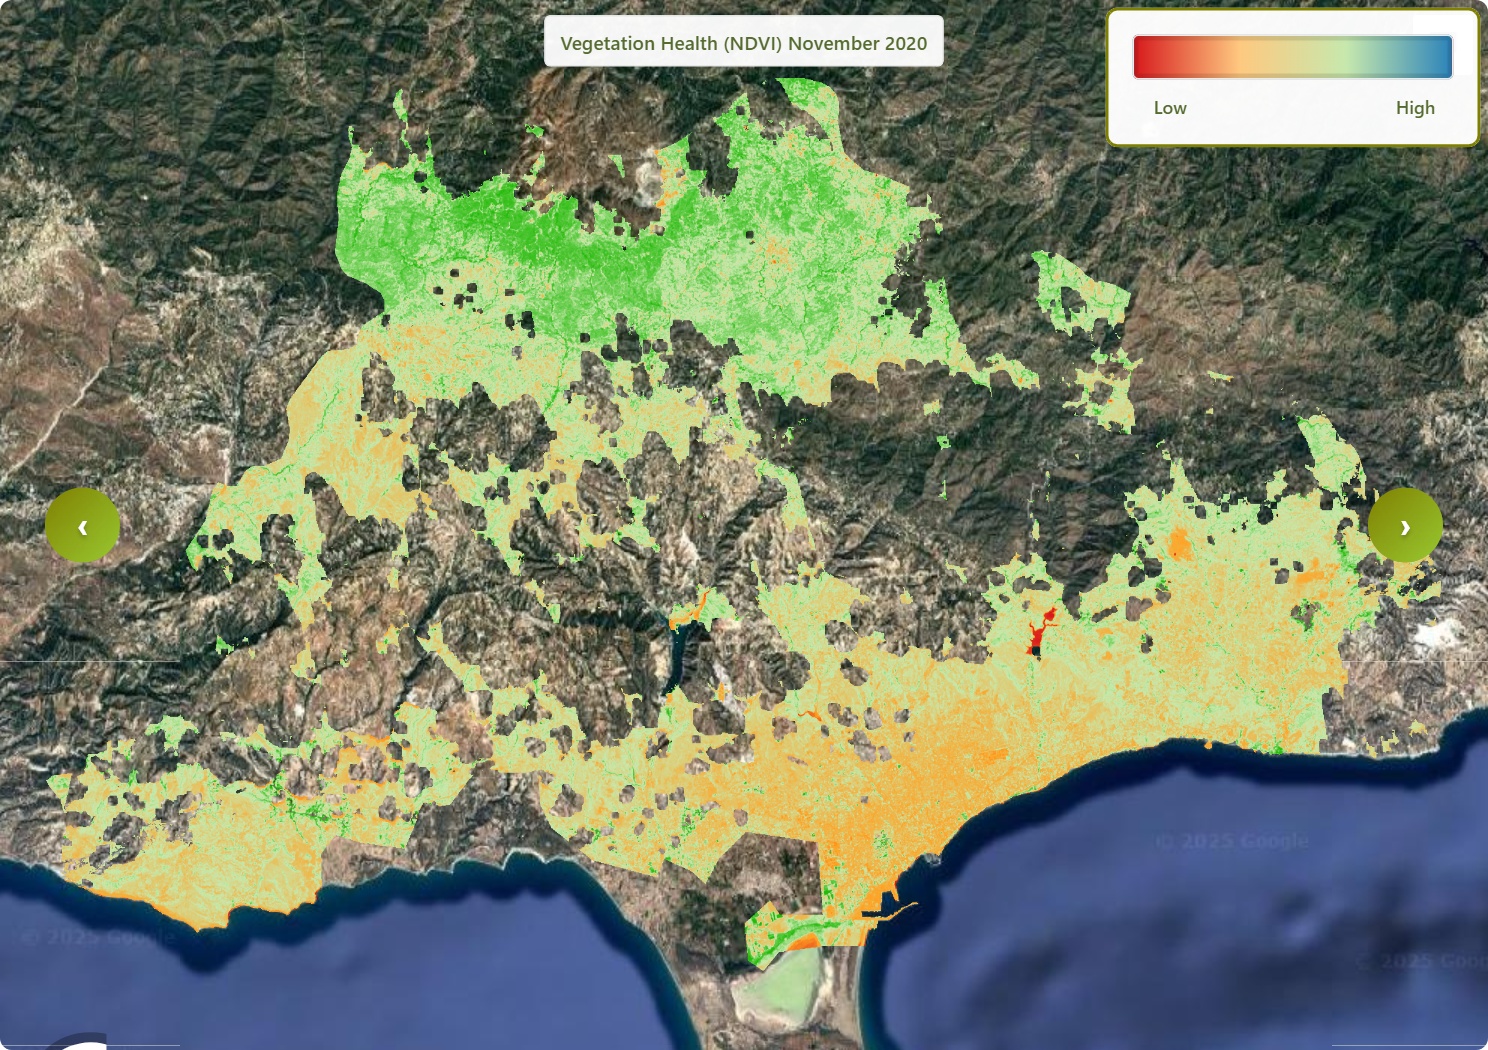 |
This figure shows the vegetation health of Limassol in 2015(Jan-Dec).In the early months, the images show strong green tones across much of Limassol, meaning plants are lush and healthy. As spring and summer arrive, the green becomes duller and more uniform, with fewer bright green patches, showing vegetation that is drier and under stress. Towards the end of the year there is a slight return of greener areas, but overall the landscape still looks weaker than at the start.
Vegetation starts in 2020 in very good condition in January and February. From March to June, plant health drops and then levels off at a lower value, staying weak through the summer and autumn. There is only a small improvement in November and December.
2021
 |
 |
|
 |
 |
 |
 |
 |
 |
 |
 |
 |
This figure shows the vegetation health of Limassol in 2015(Jan-Dec). Images for the first three months are dominated by deep green tones, showing dense and vigorous vegetation. As the year moves into late spring and summer, these greens fade, and more pale, tired-looking areas appear, indicating that plants are drying and losing strength. By the end of the year, some of the green returns, but overall vegetation still looks less lush than in the winter months.
Vegetation is very healthy from January to March, with some of the highest values of the year. From April to July, plant health falls sharply and then stays low, with only small changes through late summer and autumn. December brings a modest recovery, but it does not reach the strong levels seen at the beginning of the year.
2022
 |
 |
 |
 |
 |
 |
 |
 |
 |
 |
 |
 |
This figure shows the vegetation health of Limassol in 2015(Jan-Dec)At the start of the year, large parts of Limassol appear clearly green, pointing to healthy plants and forests. Through spring and summer, the images lose some of this brightness: green patches shrink or become paler, and more dry-looking areas appear. In the last few months, green tones spread again and look more intense, showing that vegetation recovers well by the end of the year.
Early 2022 shows fairly good vegetation health, with a small peak in February. From March to August, values gradually decline, reaching weaker levels in mid-year. From September onwards, vegetation steadily improves, and December records one of the strongest conditions of the year.
2023
 |
 |
 |
 |
 |
 |
 |
 |
 |
 |
 |
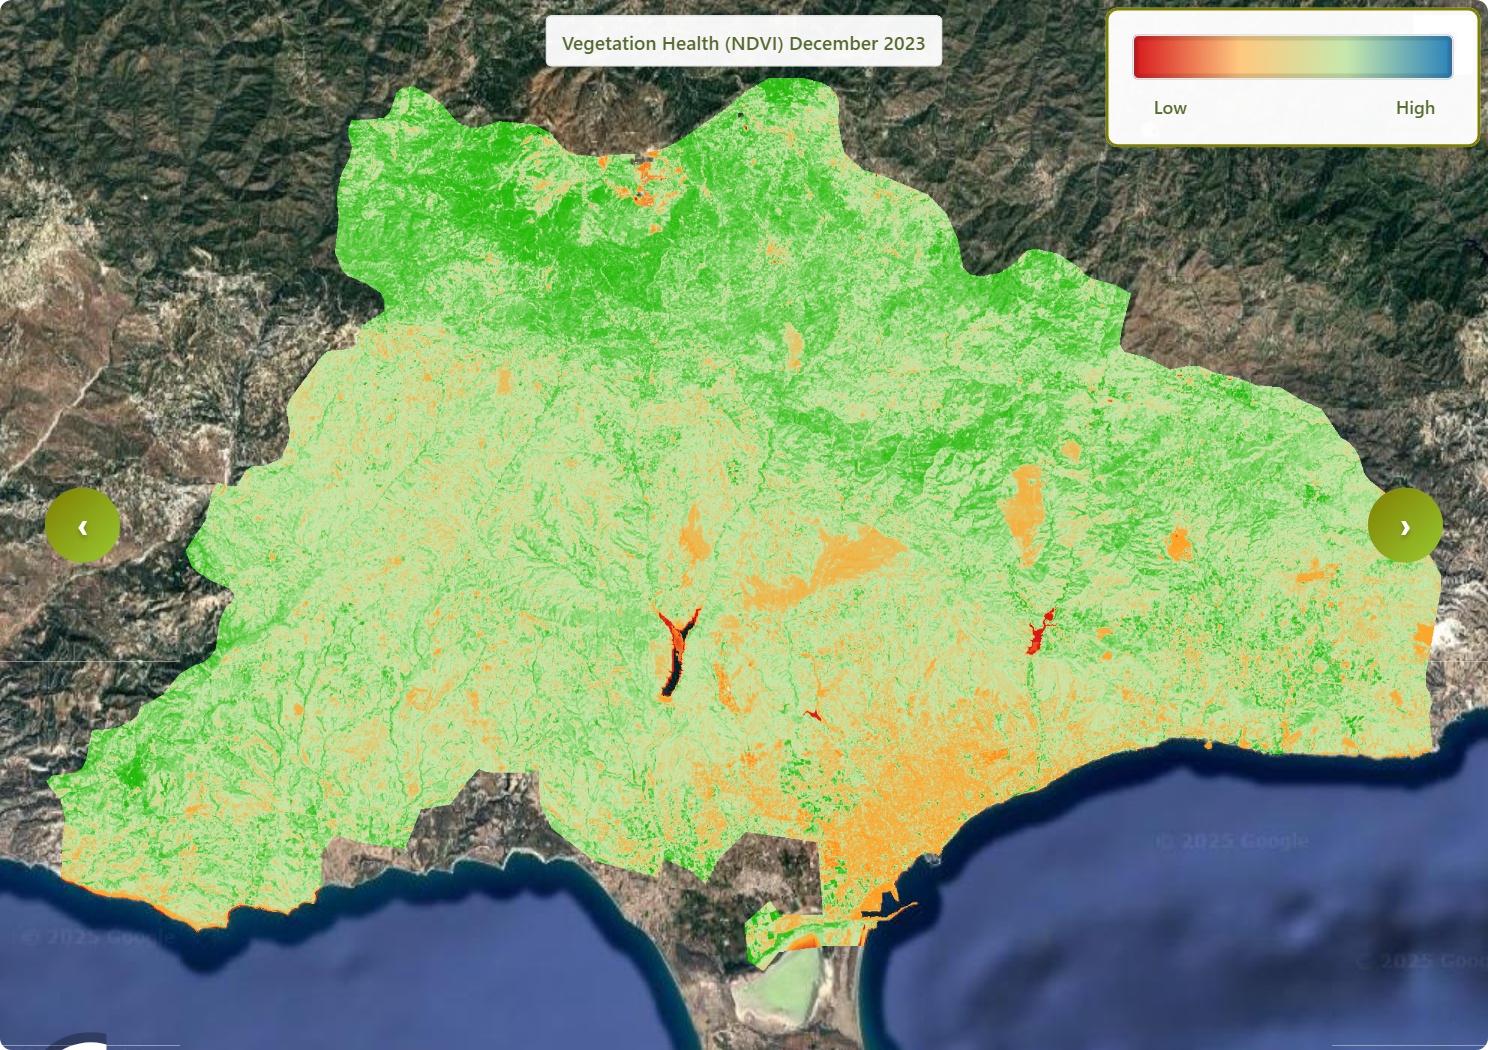 |
This figure shows the vegetation health of Limassol in 2015(Jan-Dec).Winter images show many dark-green areas, meaning vegetation is thick and doing well. As months pass into spring and summer, these greens fade and more light green or brownish tones appear, especially in open and hill areas, signalling drier and stressed plants. Towards autumn and December, the pictures show green returning and strengthening, indicating gradual recovery.
Vegetation begins 2023 in strong condition in January and February. From March to around August, plant health steadily drops, reaching its lowest point in late summer. After that, values slowly rise again, and by December vegetation is clearly healthier than in mid-year, though still a bit lower than the very start.
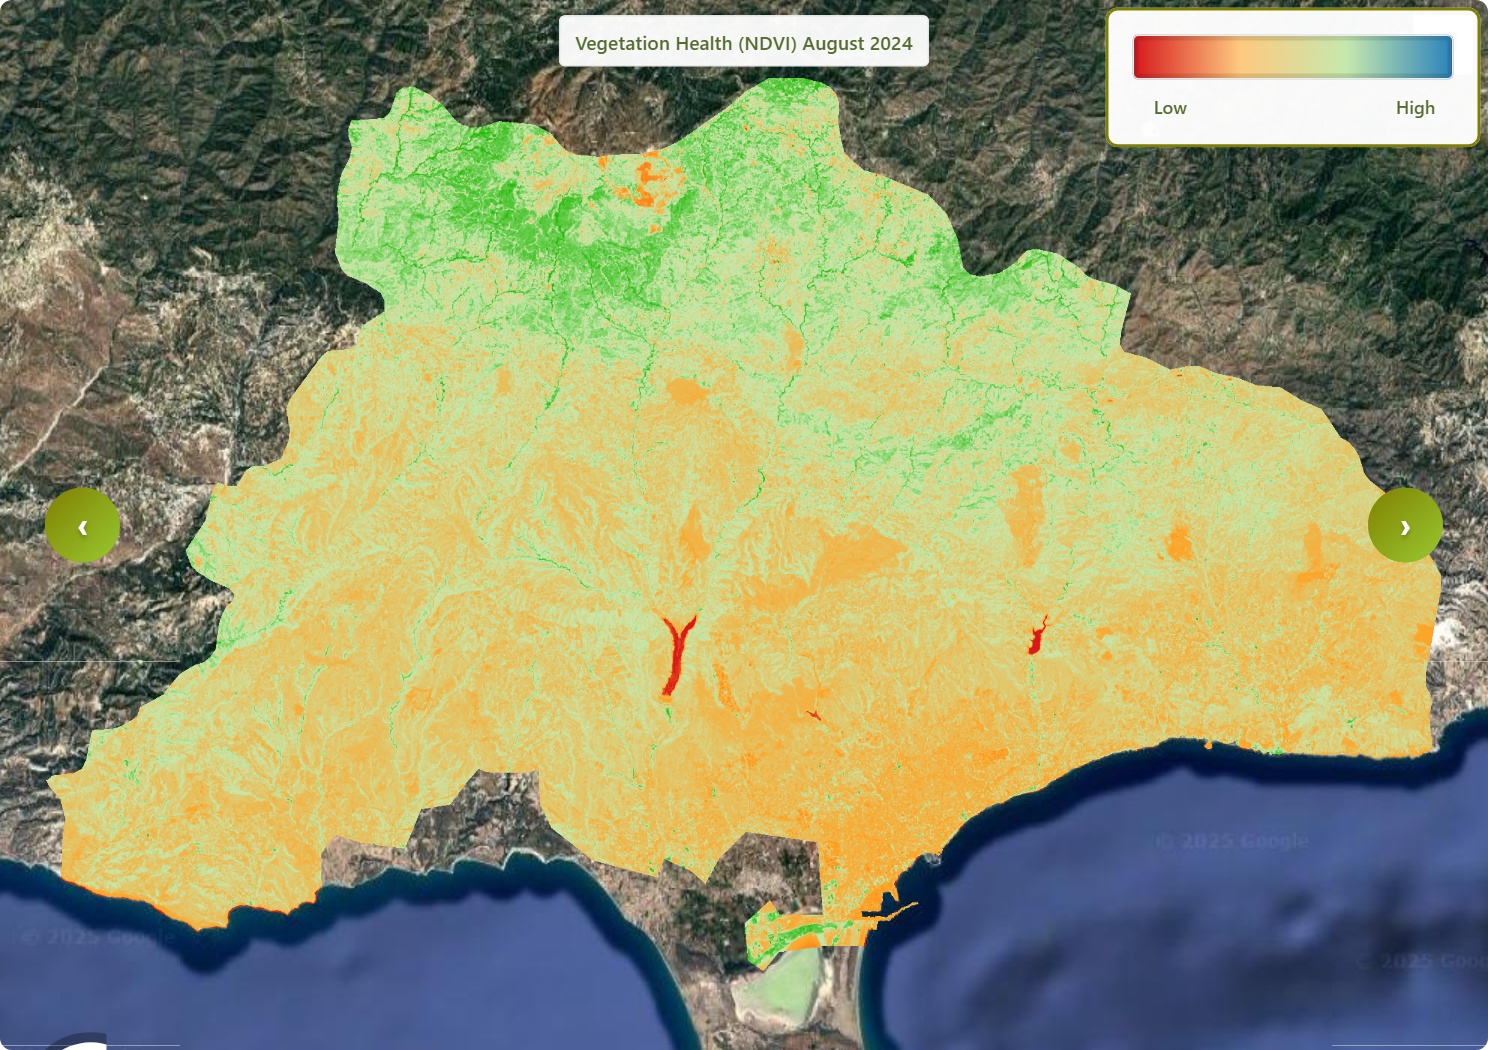
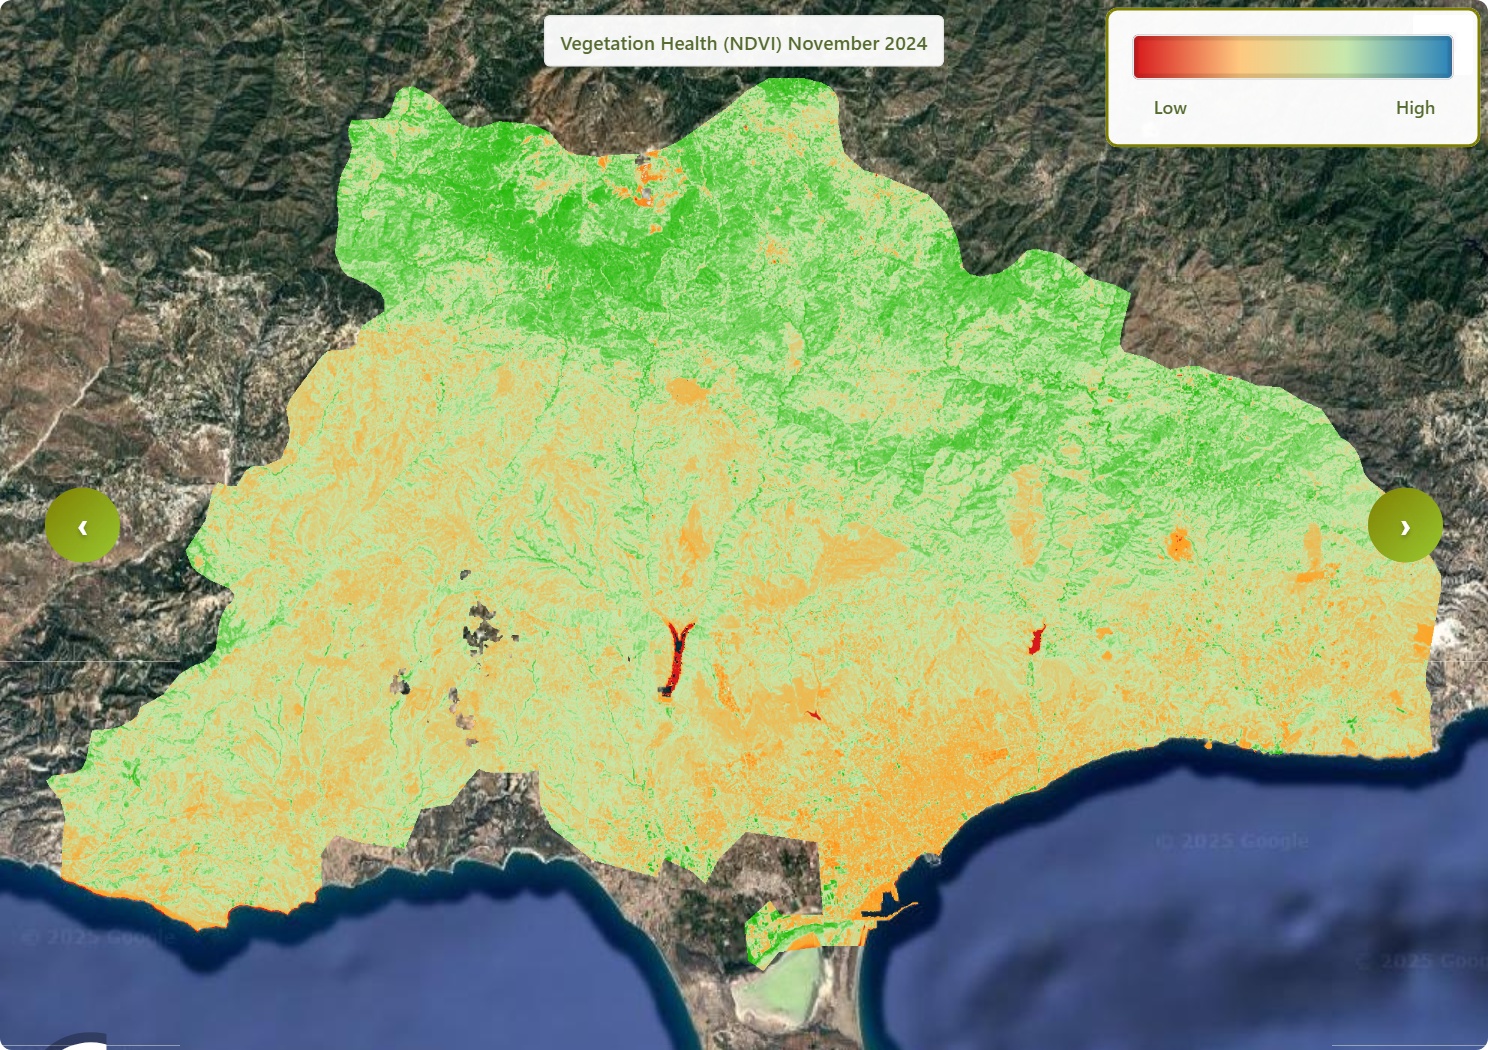
2024
 |
 |
 |
 |
 |
 |
 |
 |
 |
 |
 |
 |
This figure shows the vegetation health of Limassol in 2015(Jan-Dec).In January and February, the landscape looks quite green and fresh. Moving into spring and especially summer, the images show more faded greens and dry patches, indicating that plants are under water and heat stress. In the later months, green tones slowly return and become stronger, showing that vegetation is recovering by the end of the year.
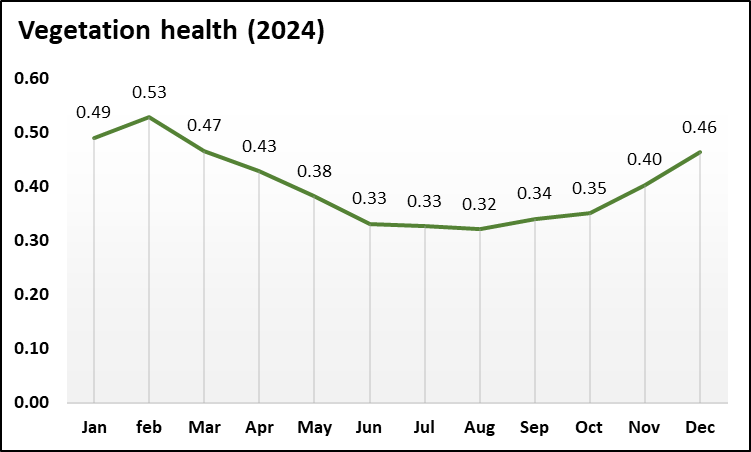
The year starts with good vegetation health and reaches a small peak in February. From March to July, values steadily decline, staying weak through the height of summer. From August onwards the graph shows a slow but clear rise, ending in December with much better plant condition than in mid-year.
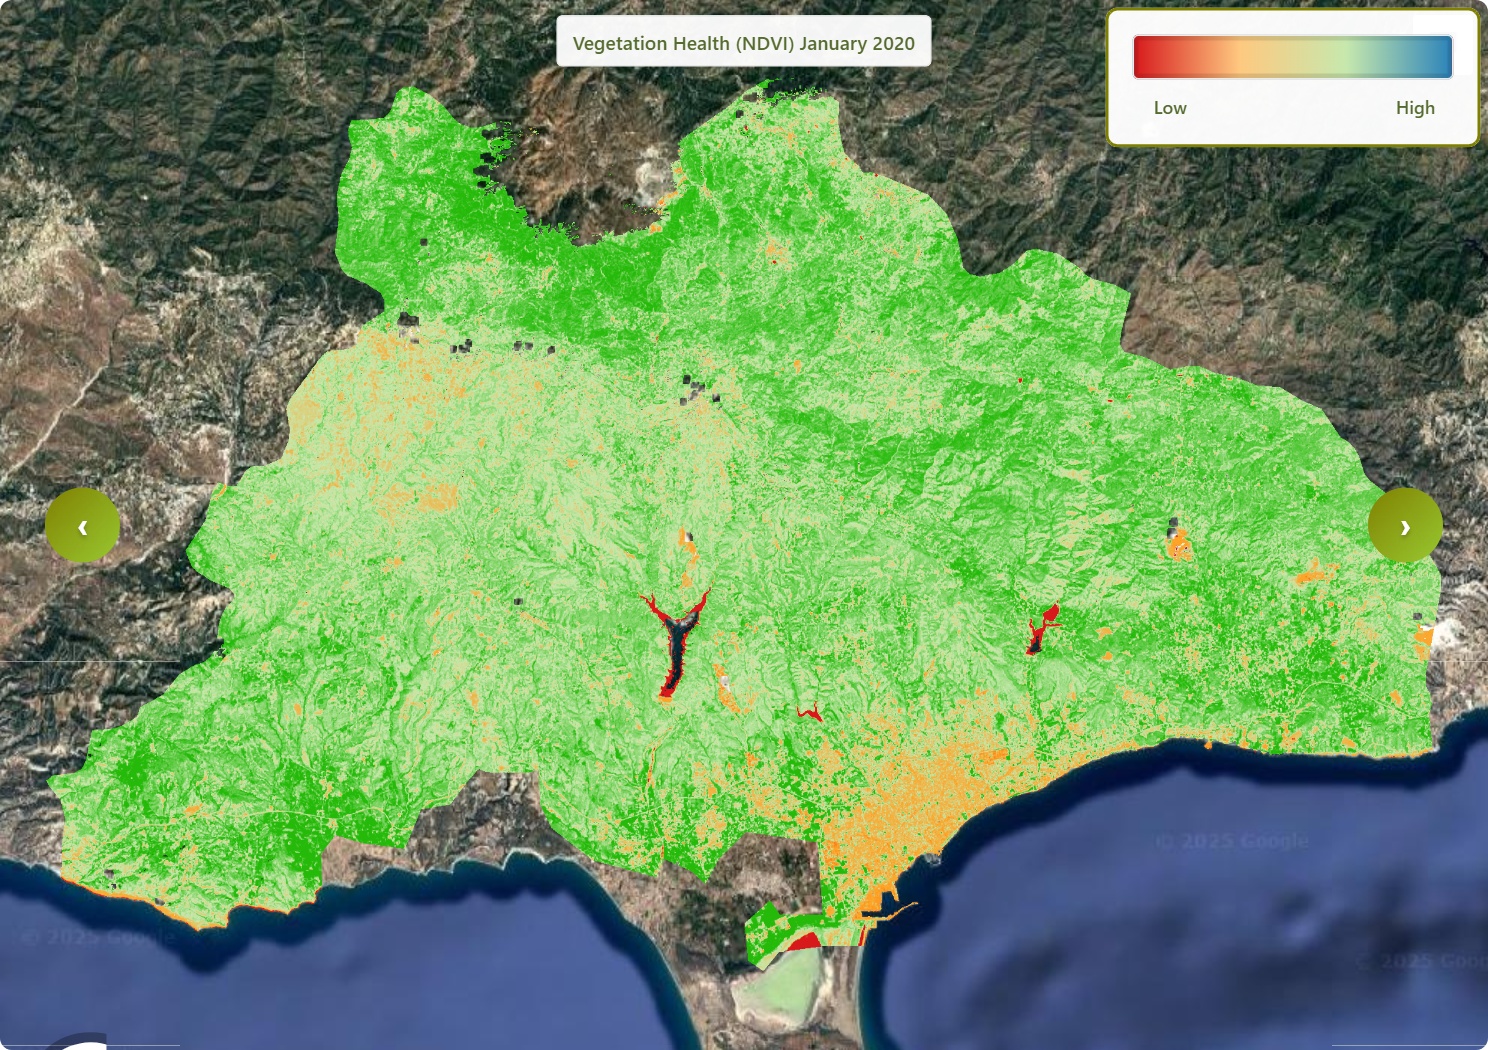
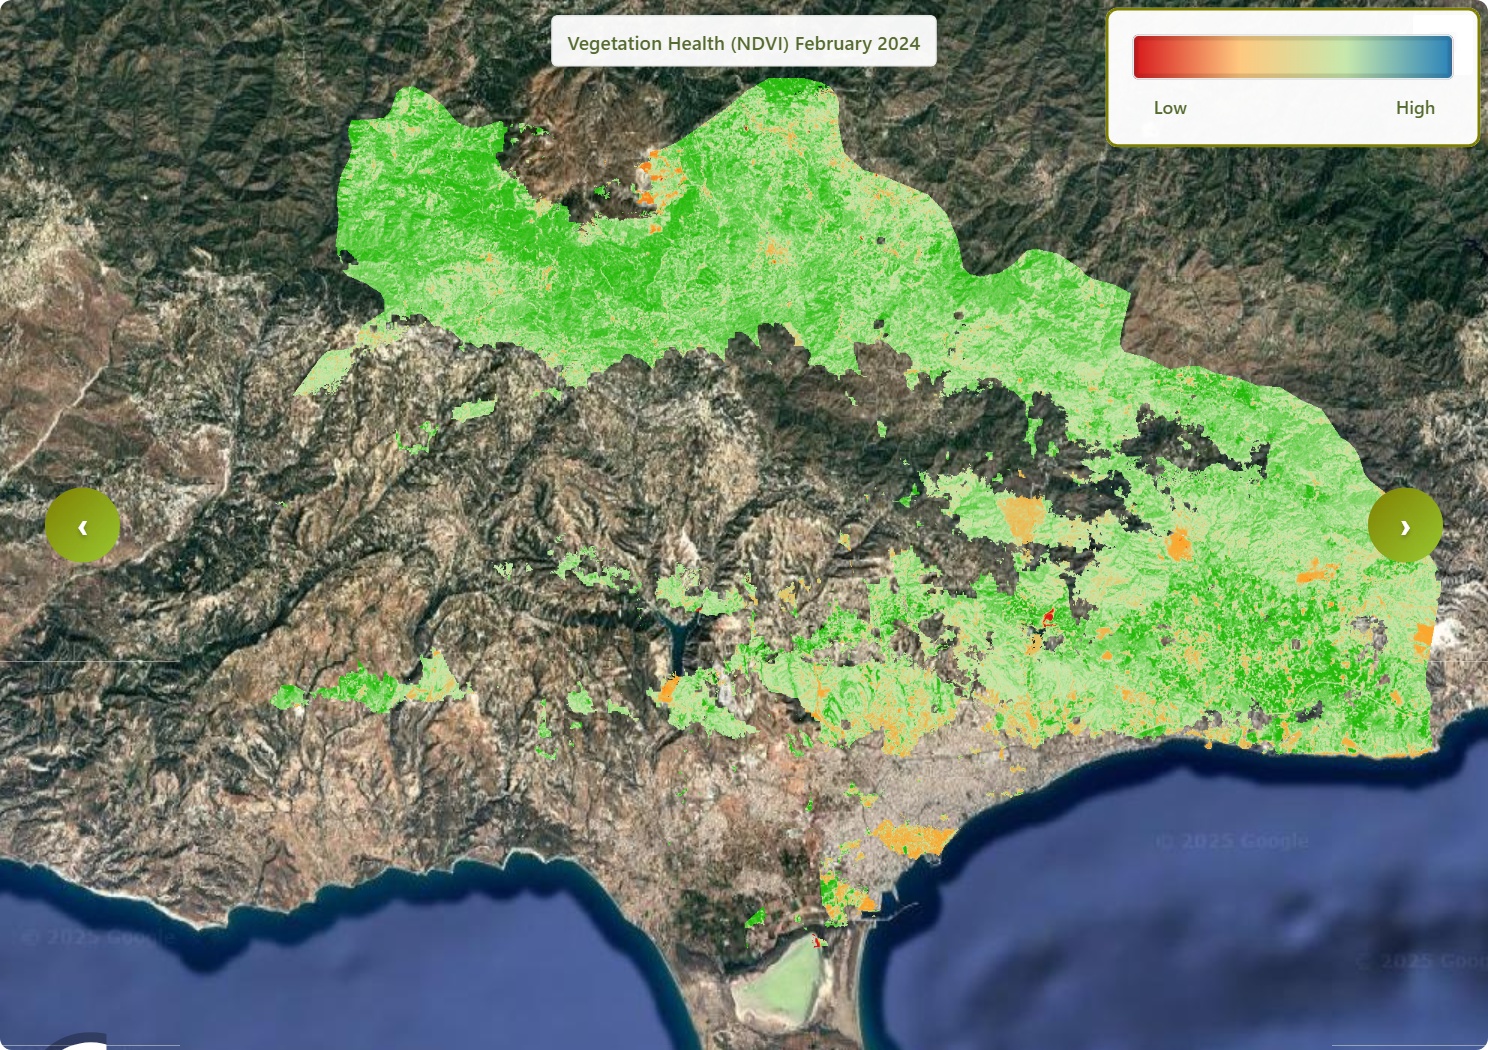
2025
 |
 |
 |
 |
 |
 |
 |
 |
 |
 |
 |
 |
This figure shows the vegetation health of Limassol in 2015(Jan-Dec). Early-year images show many rich green patches, meaning plants are in good shape. As the year moves into spring and summer, the greens fade, and more pale or brownish areas spread, especially on slopes and open land, showing increasing dryness and stress. By late summer, only a few areas look moderately green, and overall, the landscape appears much less lush than at the start of the year.

In 2025, vegetation starts off healthy in January and February. From March onwards, values keep dropping month by month, reaching much weaker levels by late summer. Only a very small uptick appears in September, with no strong recovery visible yet.
Result and discussion
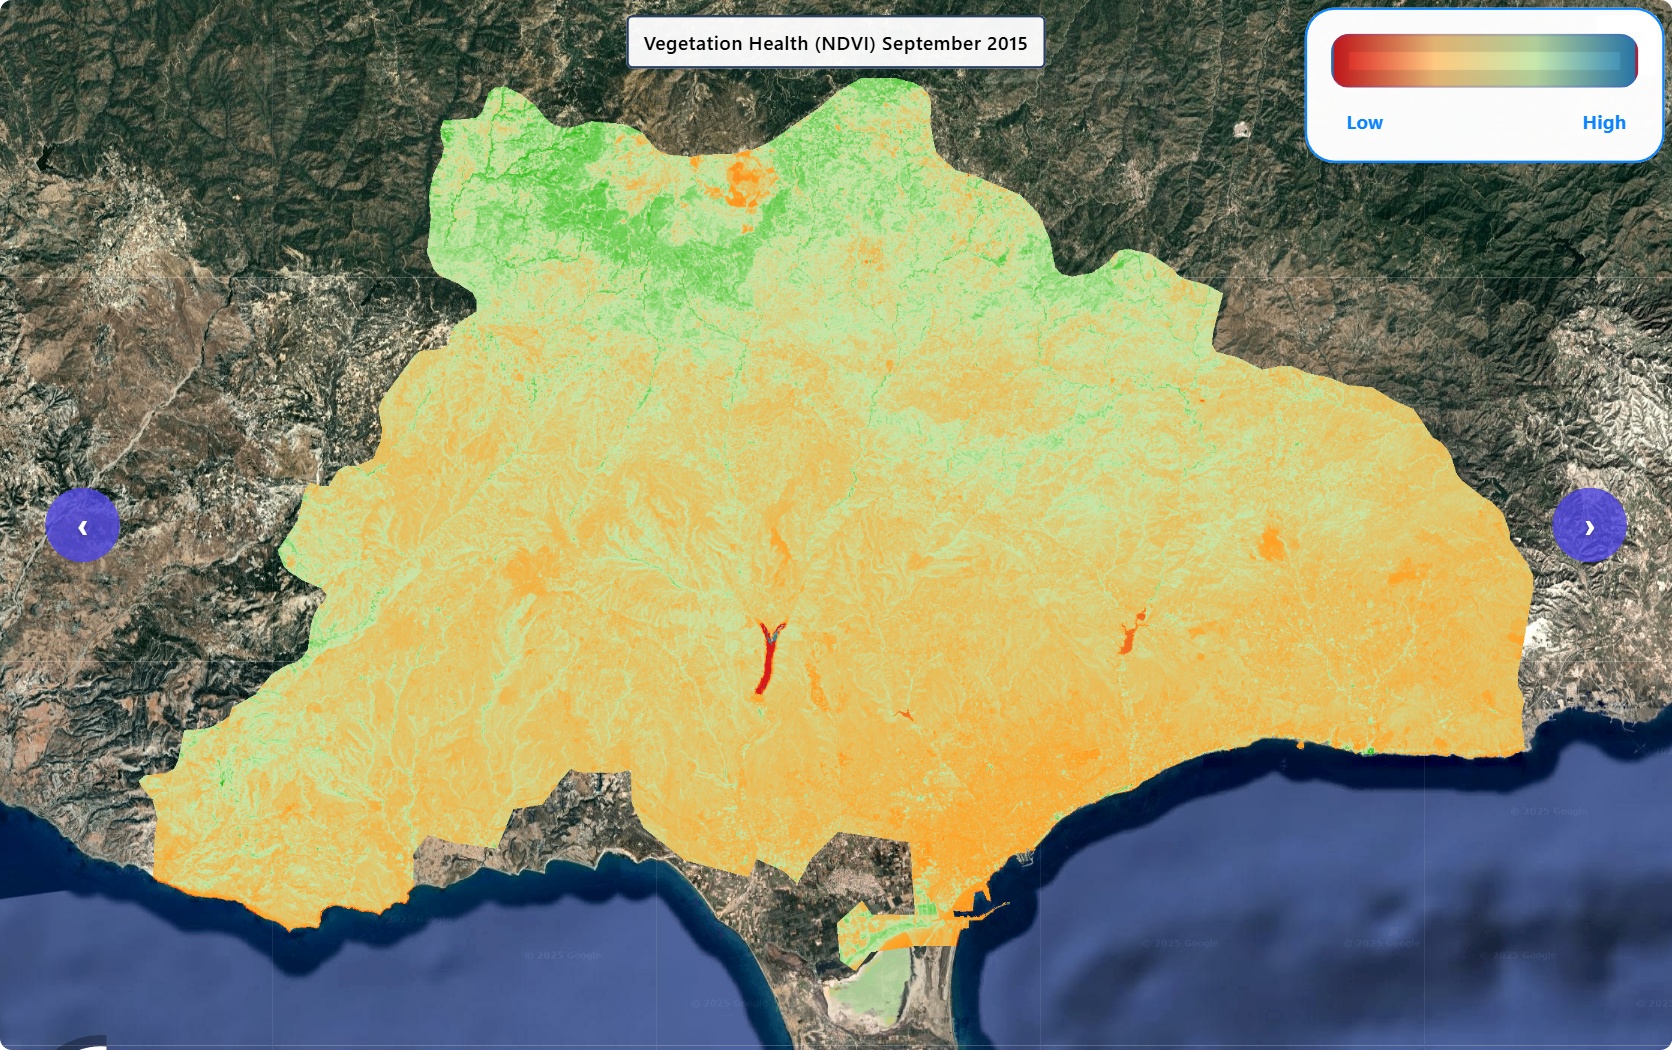
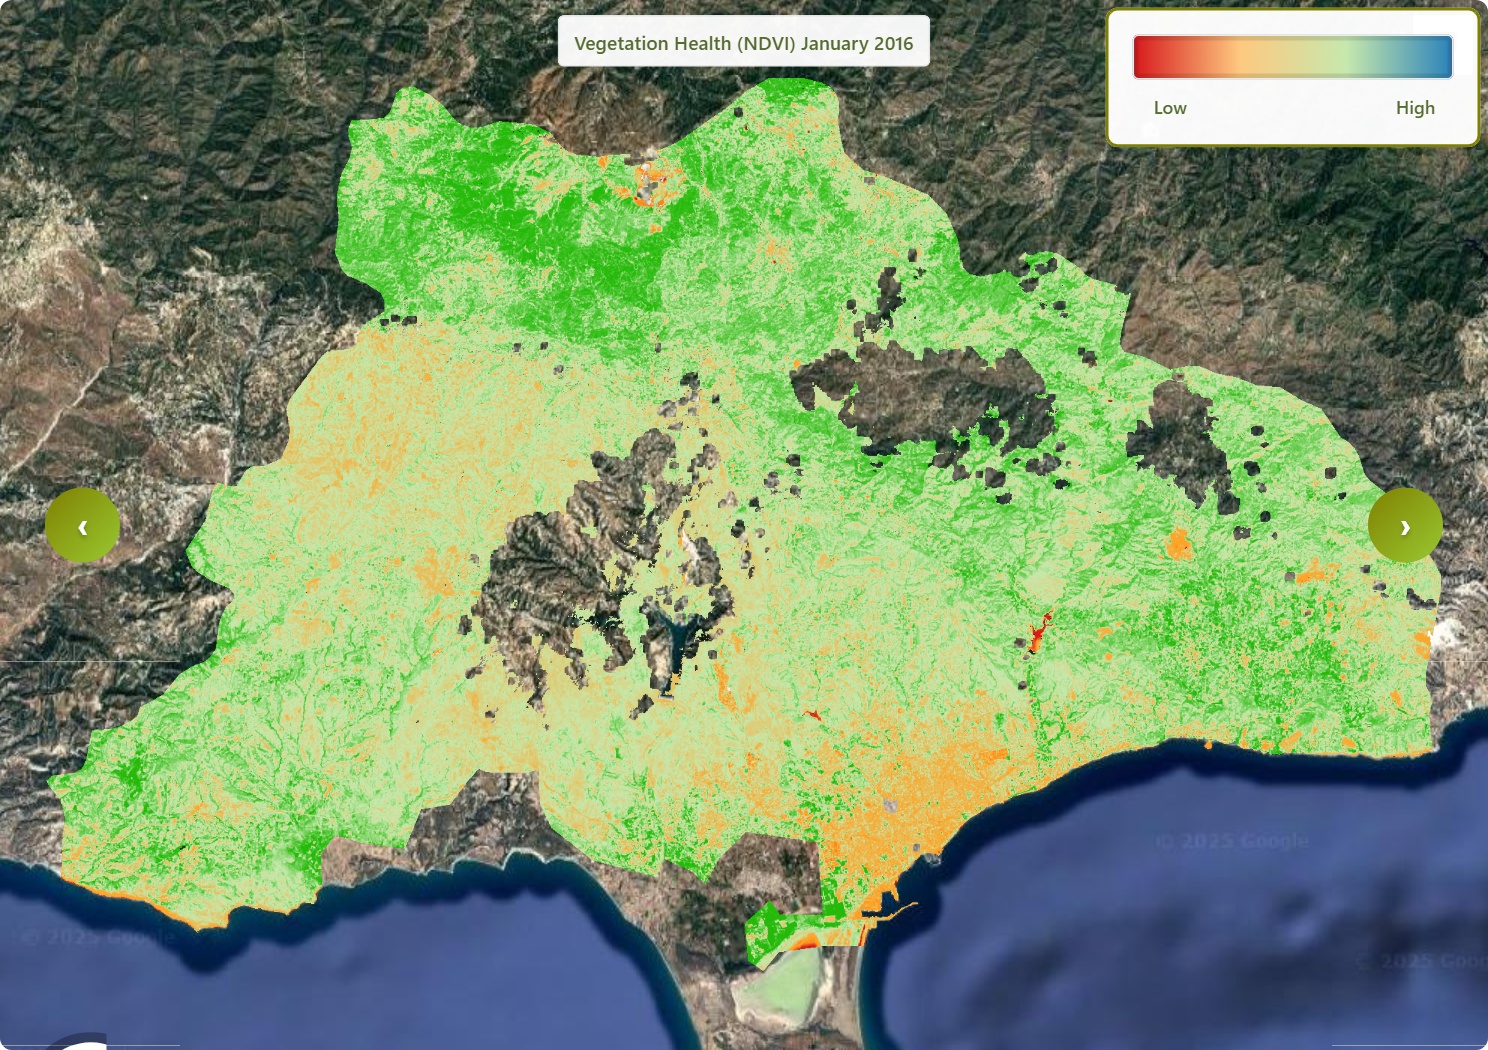
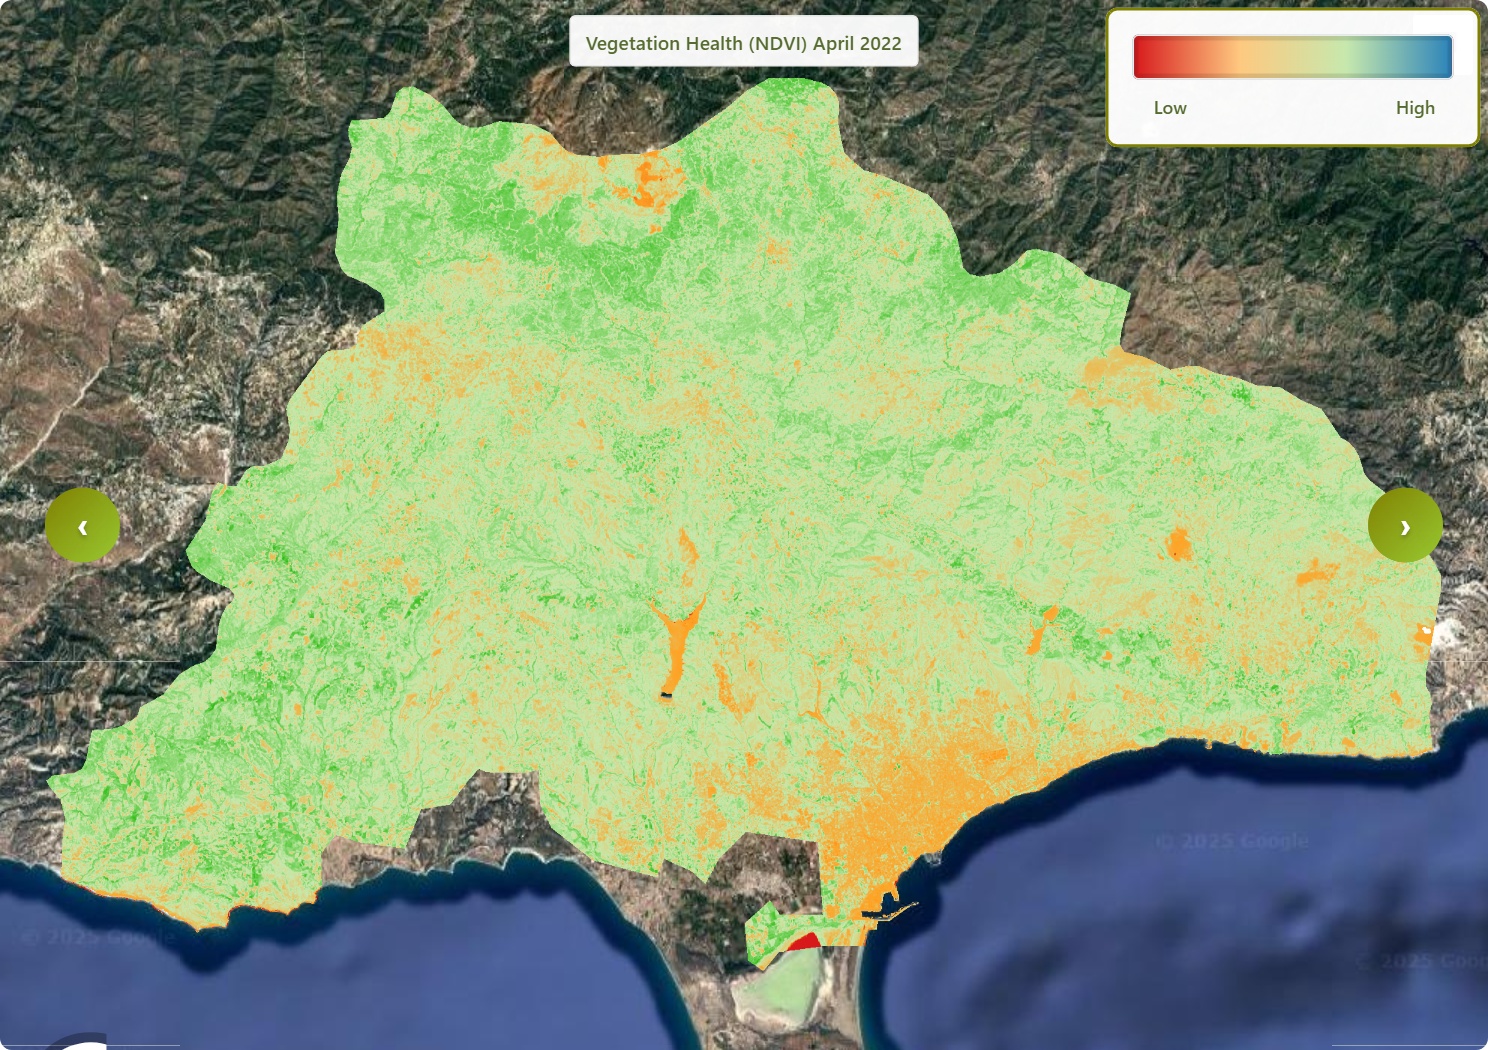
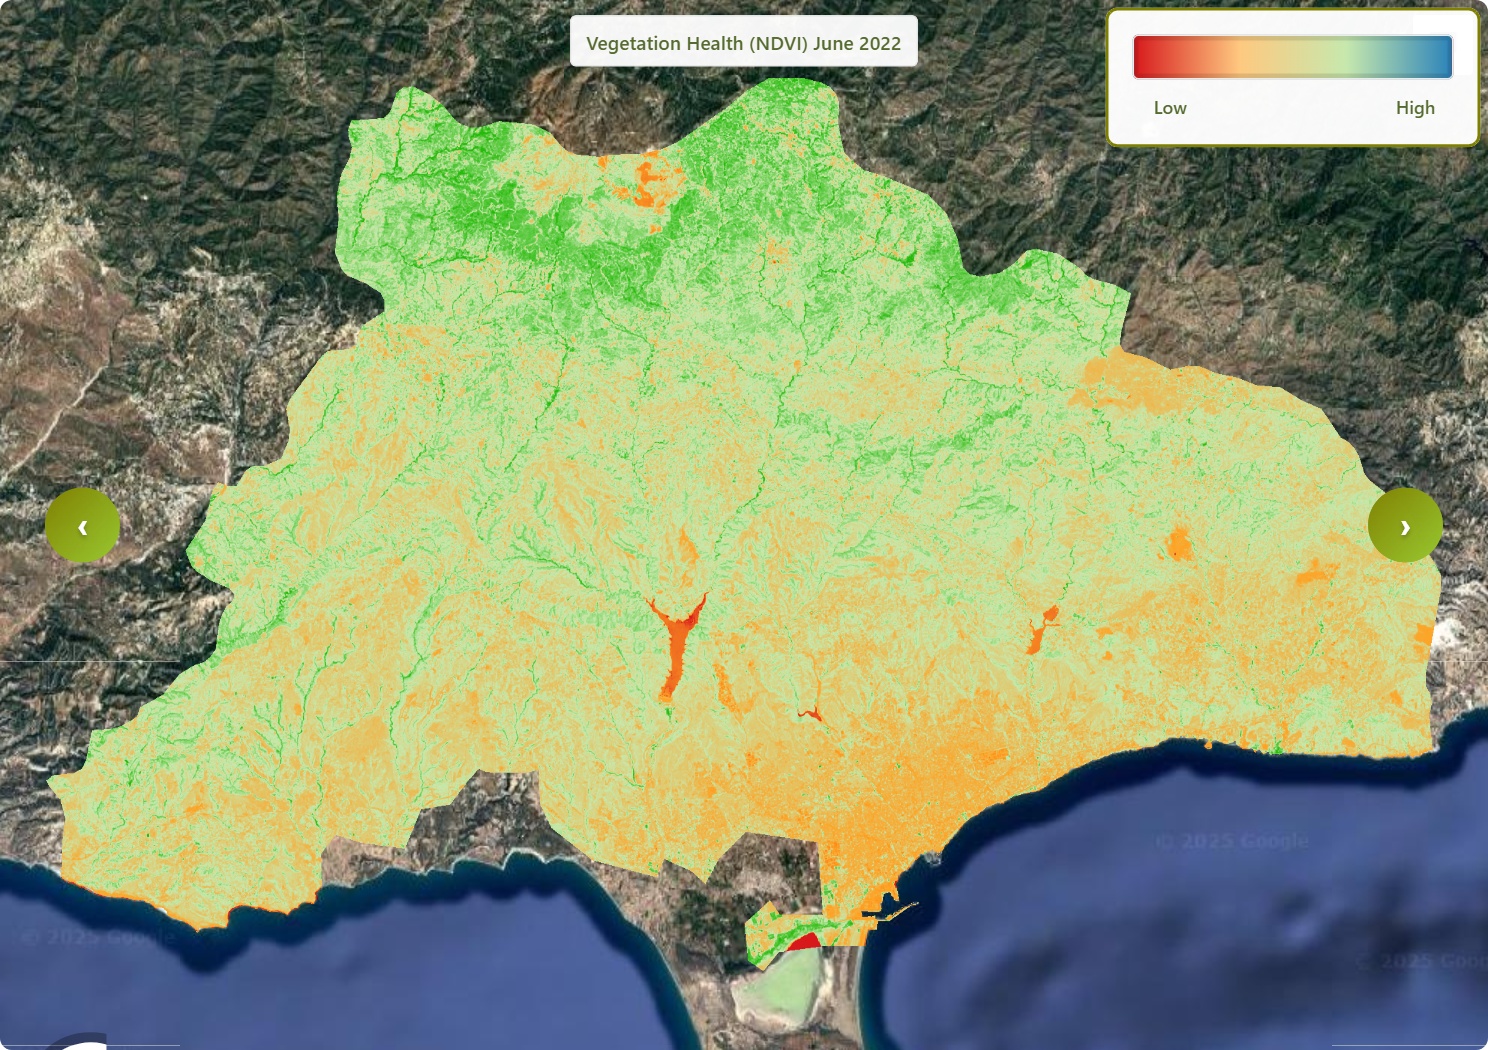
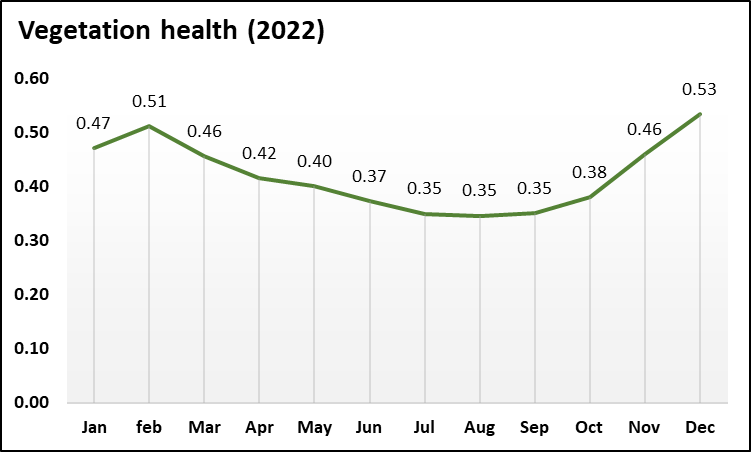
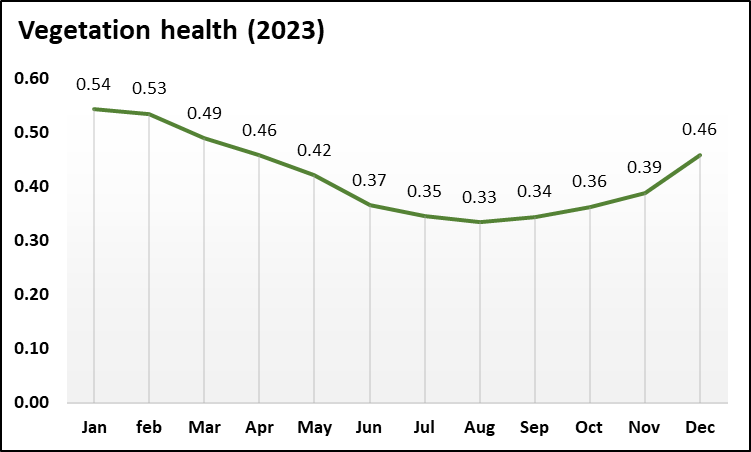
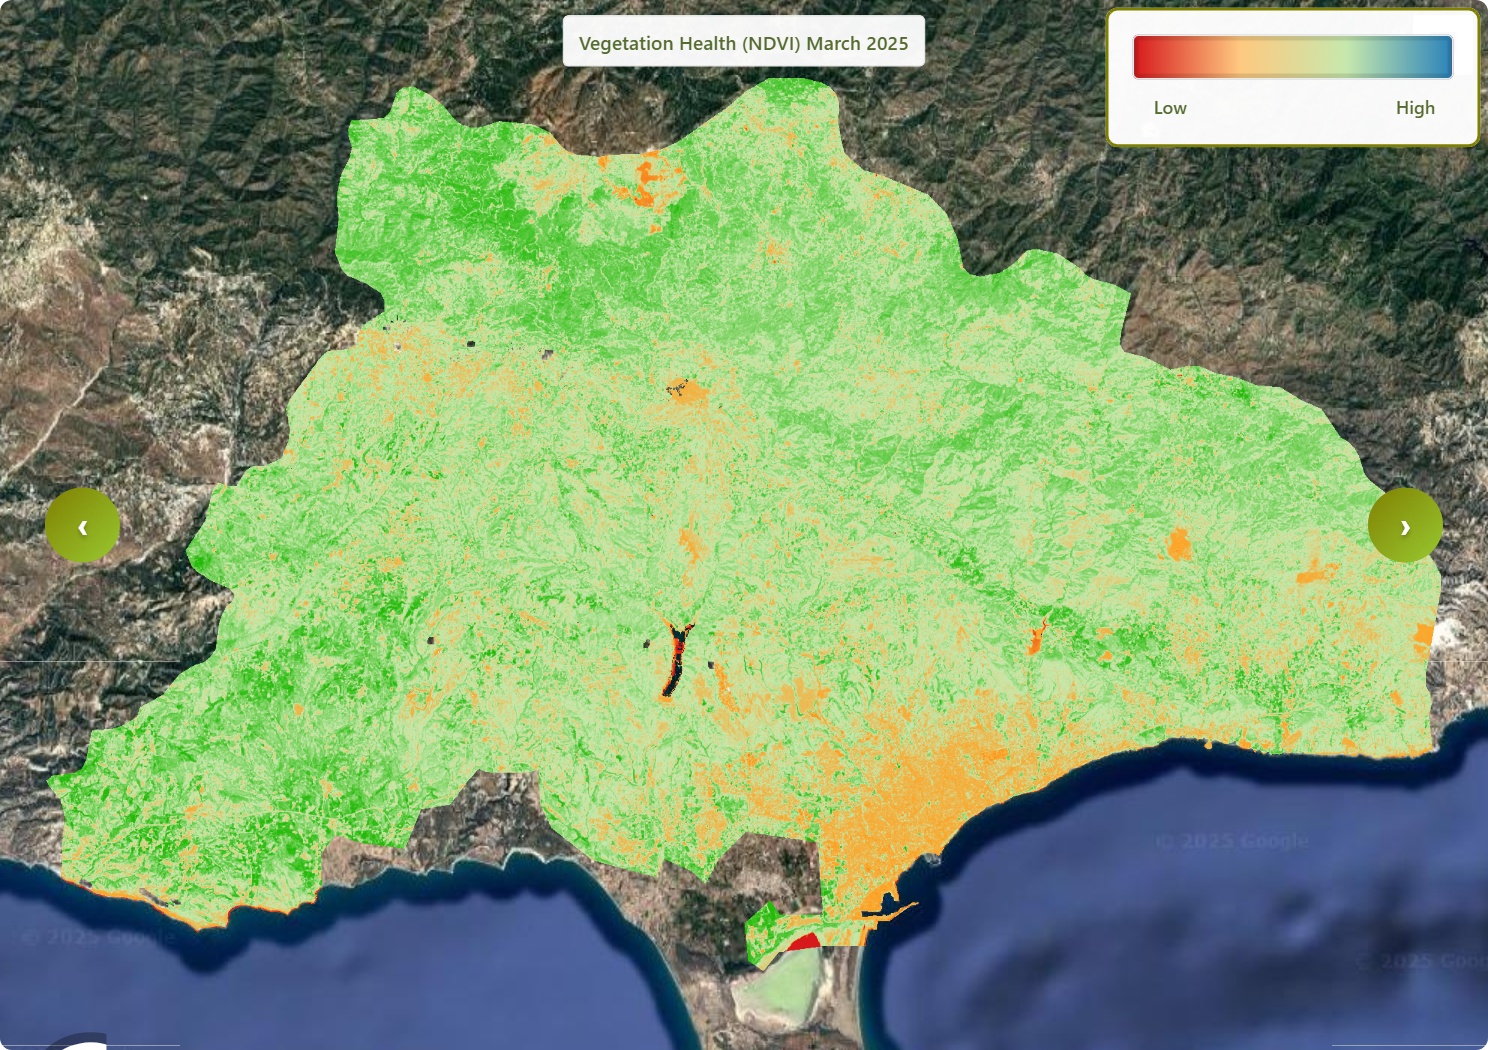
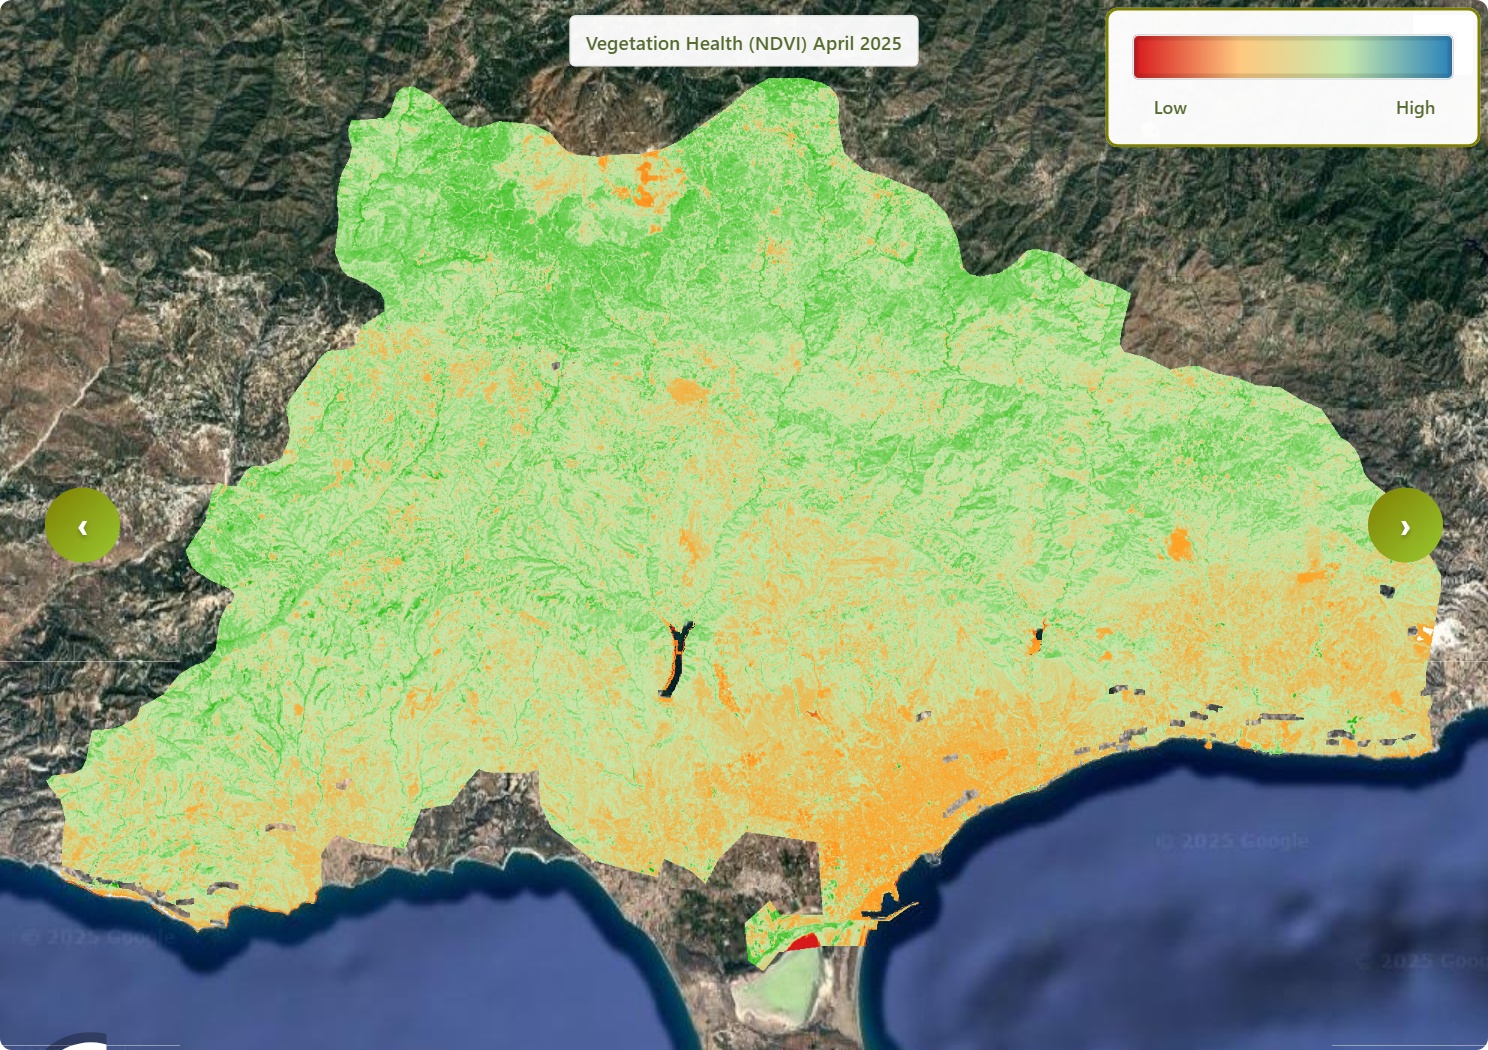
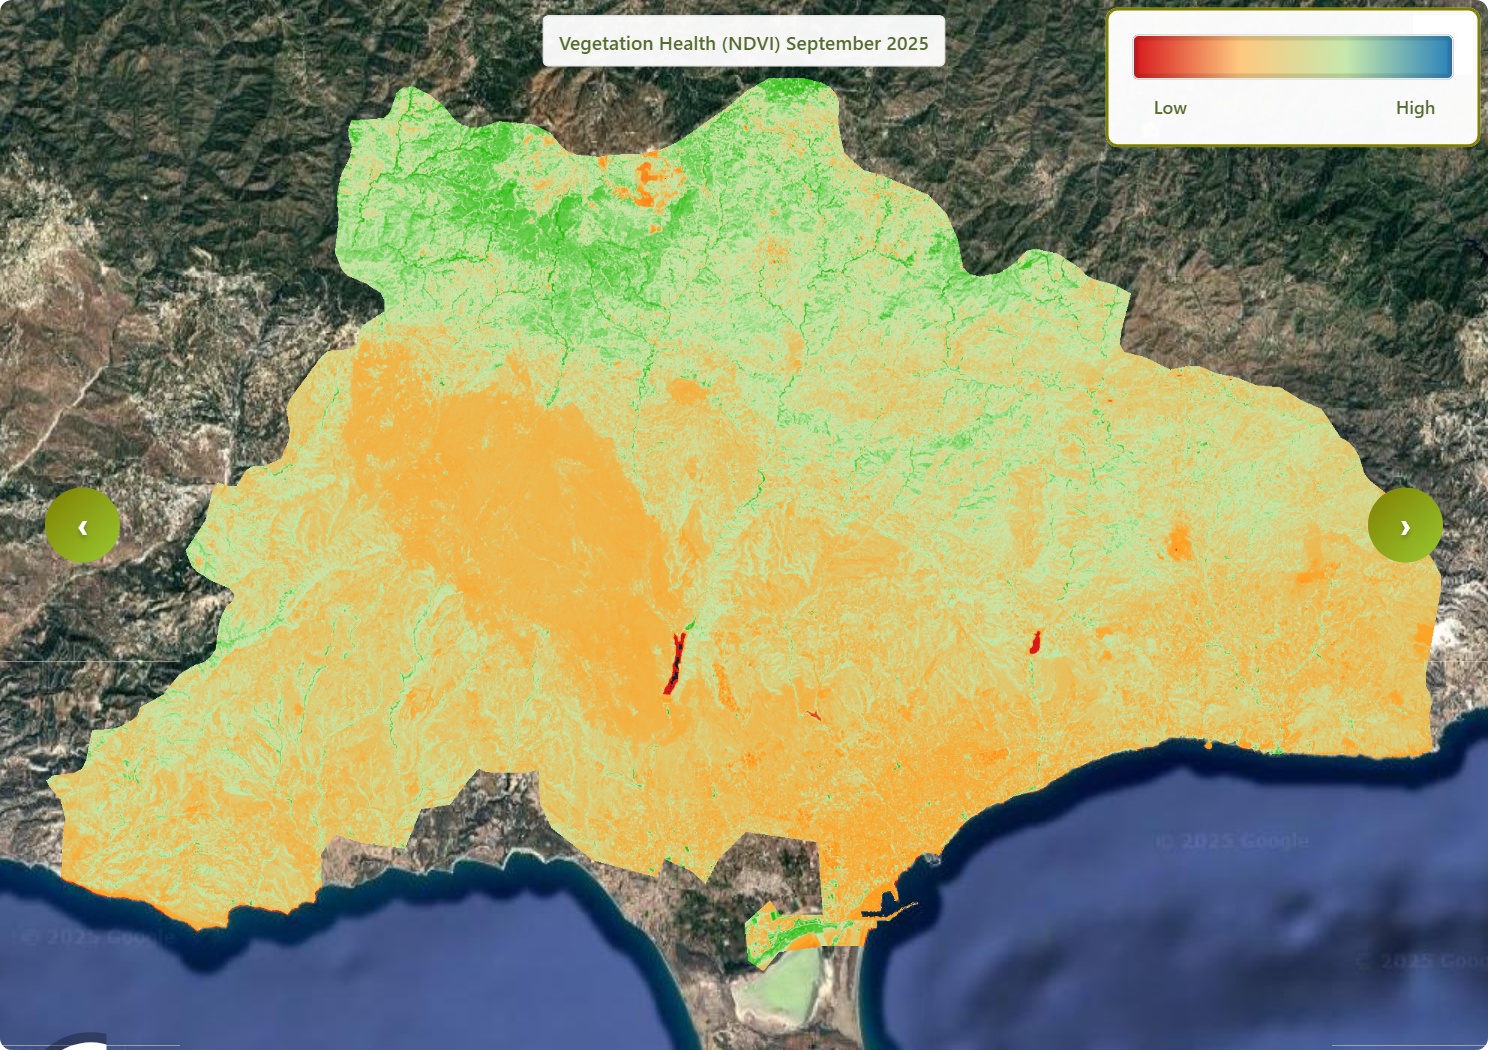
Limassol has a Mediterranean climate characterised by hot, dry summers that begin in mid-May and last until mid-September. During this time, we need to remain particularly vigilant regarding wildfire risks. Data and images clearly indicate that values related to vegetation health, plant moisture, and dense vegetation in areas affected by burn damage are significantly lower compared to other months of the year. This situation is unfavourable as it facilitates the spread of wildfires.
As the ground temperature rises, vegetation dries out, reducing moisture levels in plants and making them more susceptible to fire. Furthermore, rainfall data reveals a concerning trend: annual rainfall has declined since 2019. In 2019, the annual rainfall was 910 mm, but it dropped to 594 mm in 2024. This decrease indicates less moisture in the ground and soil, leading to drier vegetation and decreased plant moisture overall.
The analysis of these parameters suggests that if a fire were to ignite, it could escalate into a megafire. This is not merely an assumption; the data corroborates this risk. The indicators show that the threat in Limassol is very high for the upcoming months. The trends suggest that the next dry season will be particularly conducive to the rapid spread of wildfires, potentially resulting in a megawildfire.
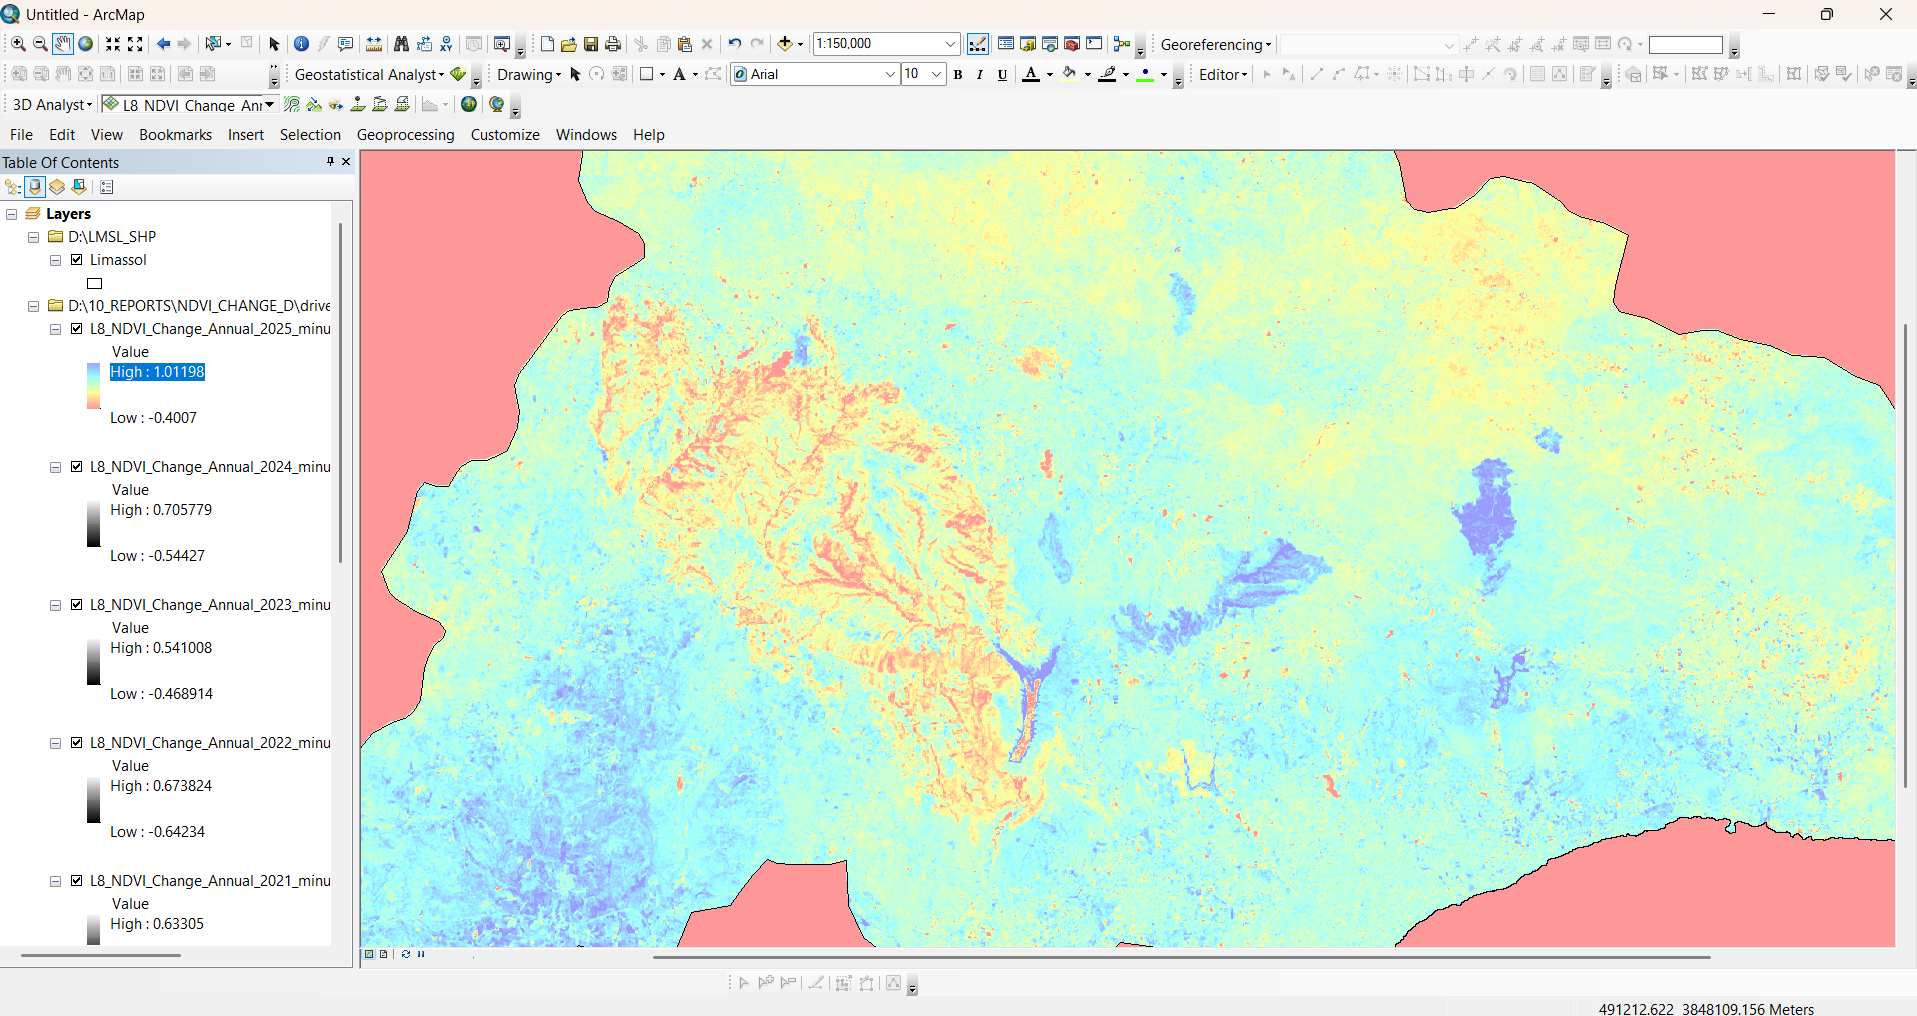
We have thoroughly analysed the various parameters in Limassol on a monthly, seasonal, and annual basis. Patterns and trends have been examined, and following the methodology outlined in Figure 12, we have prepared the Fire Risk Map for Limassol. This methodology assesses each parameter in different areas and assigns a corresponding risk class.
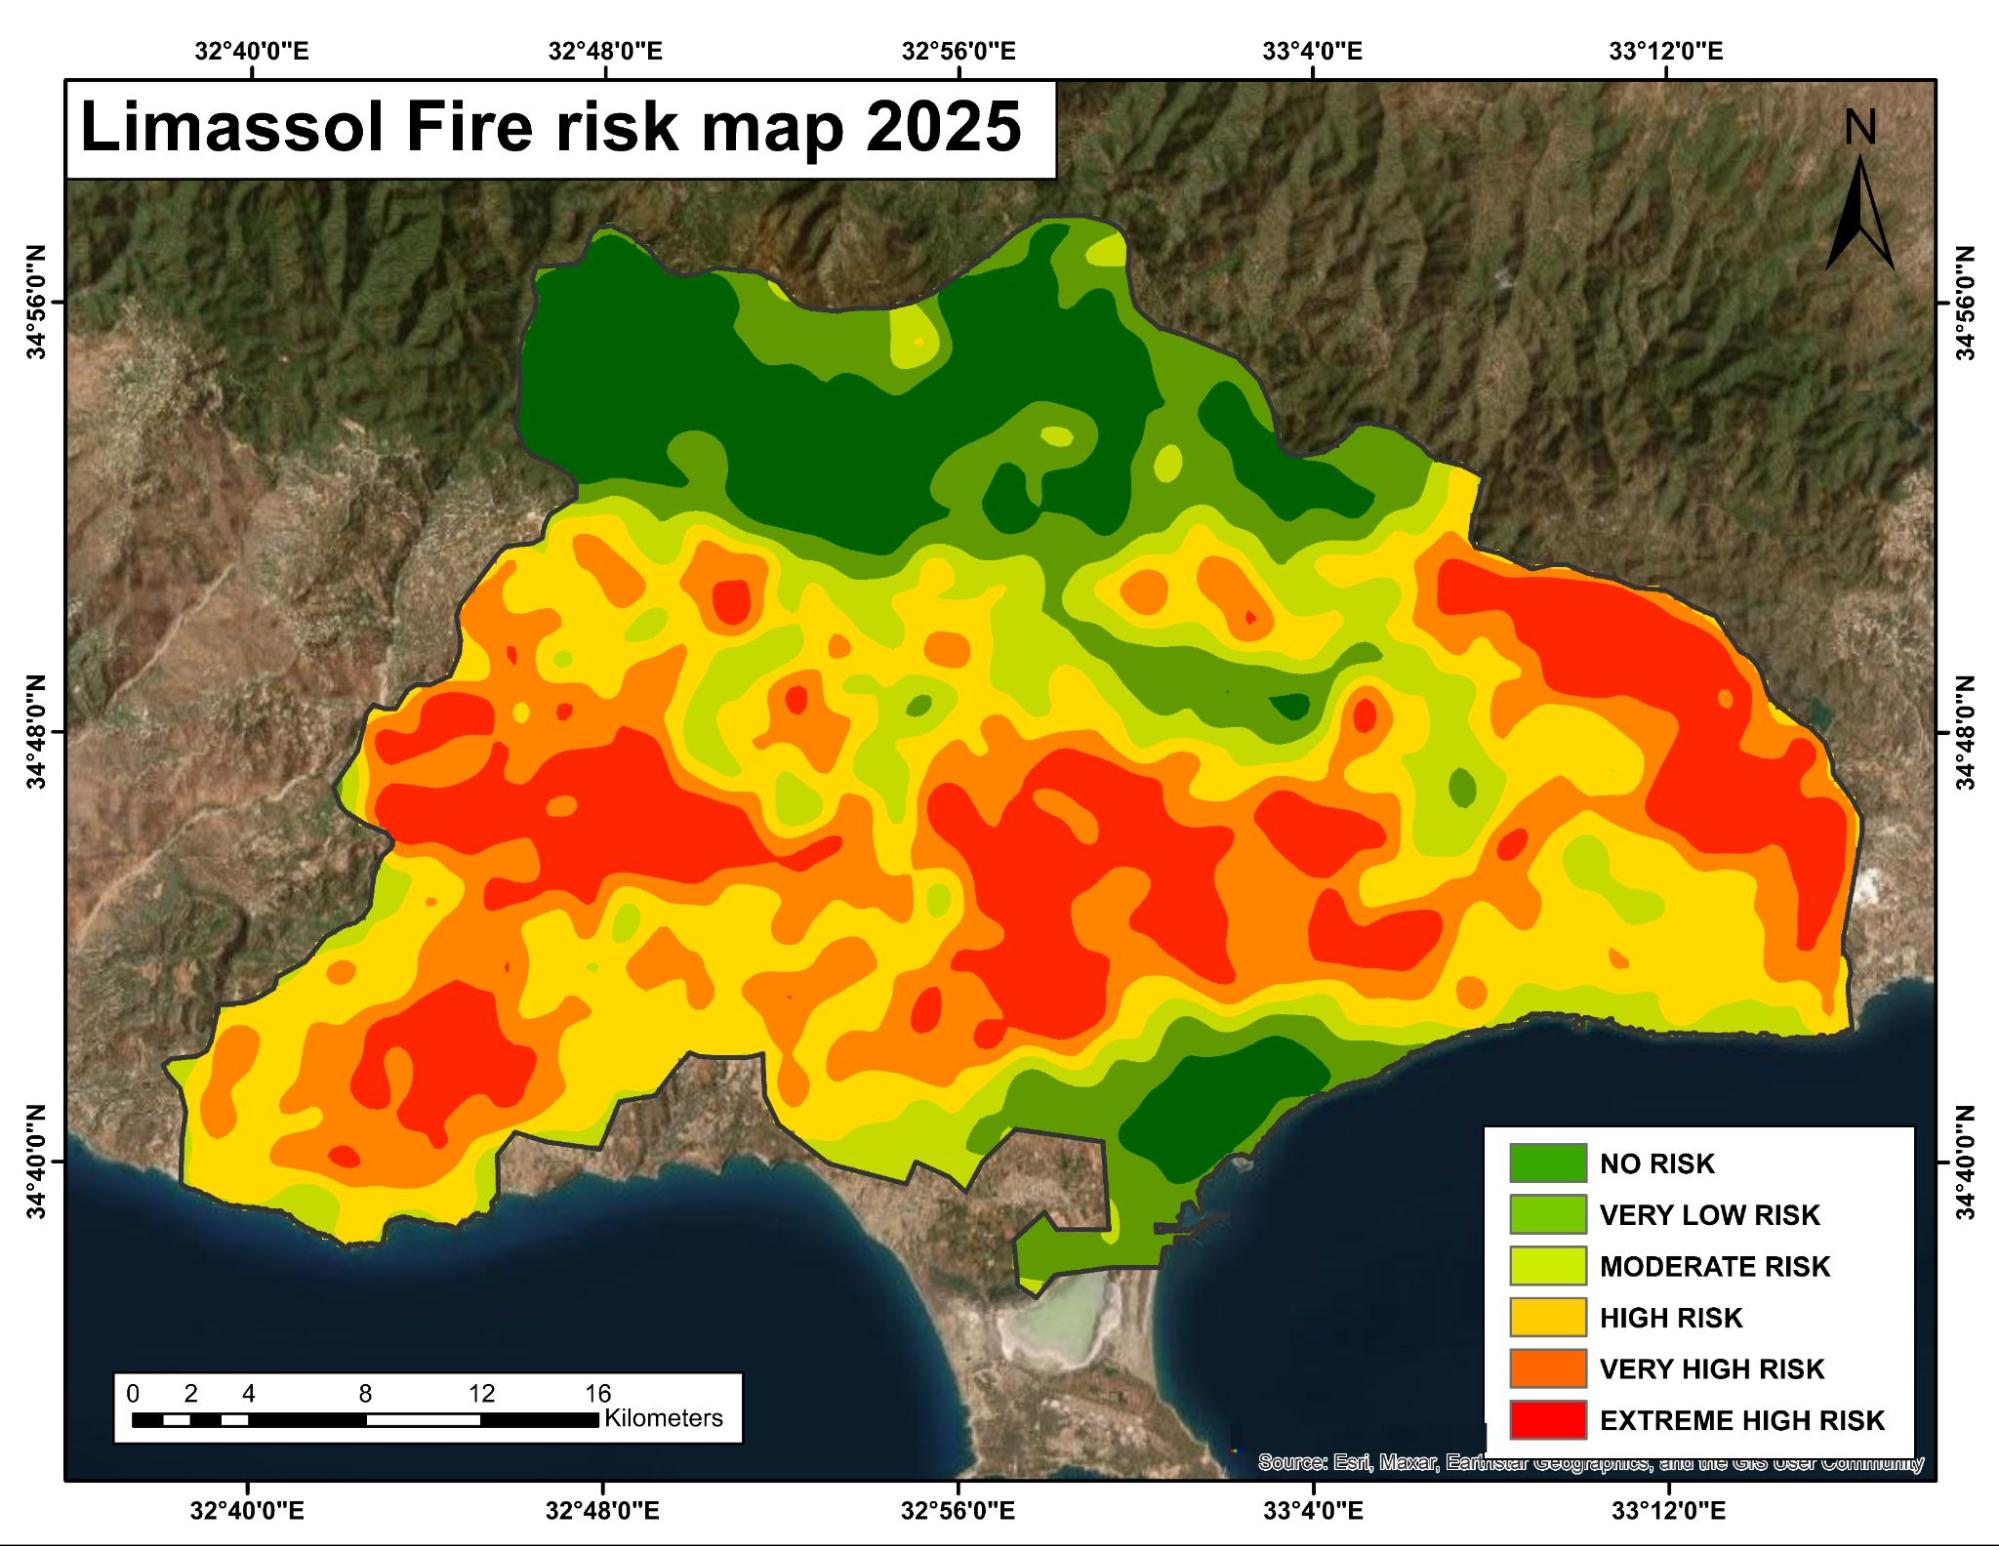
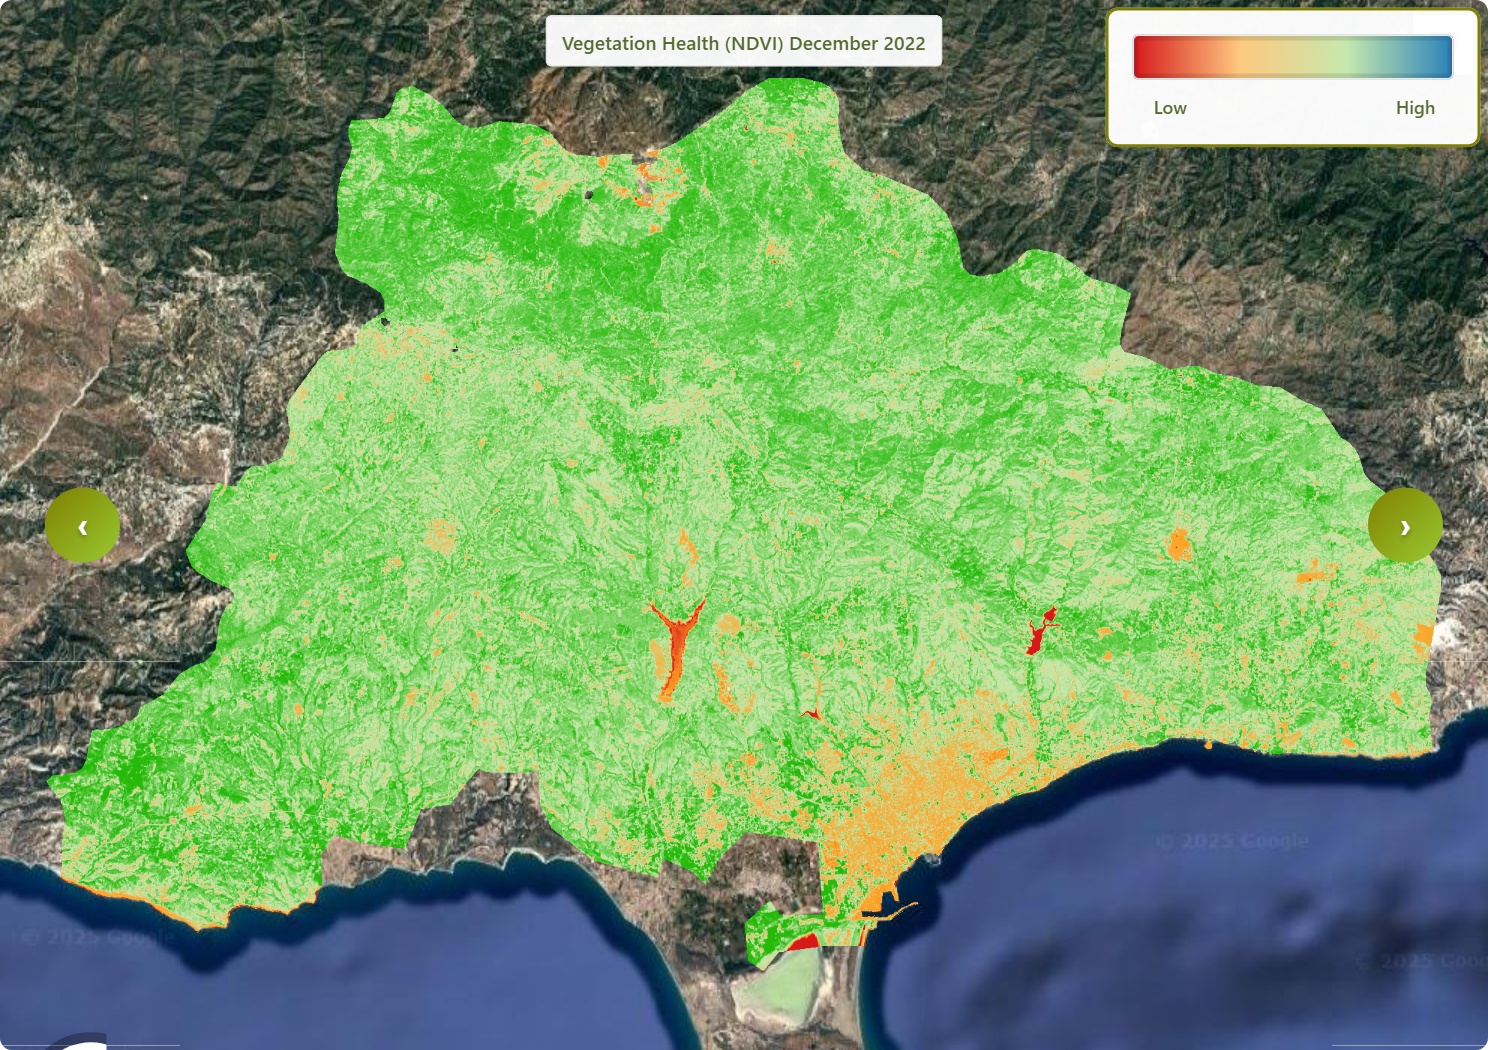
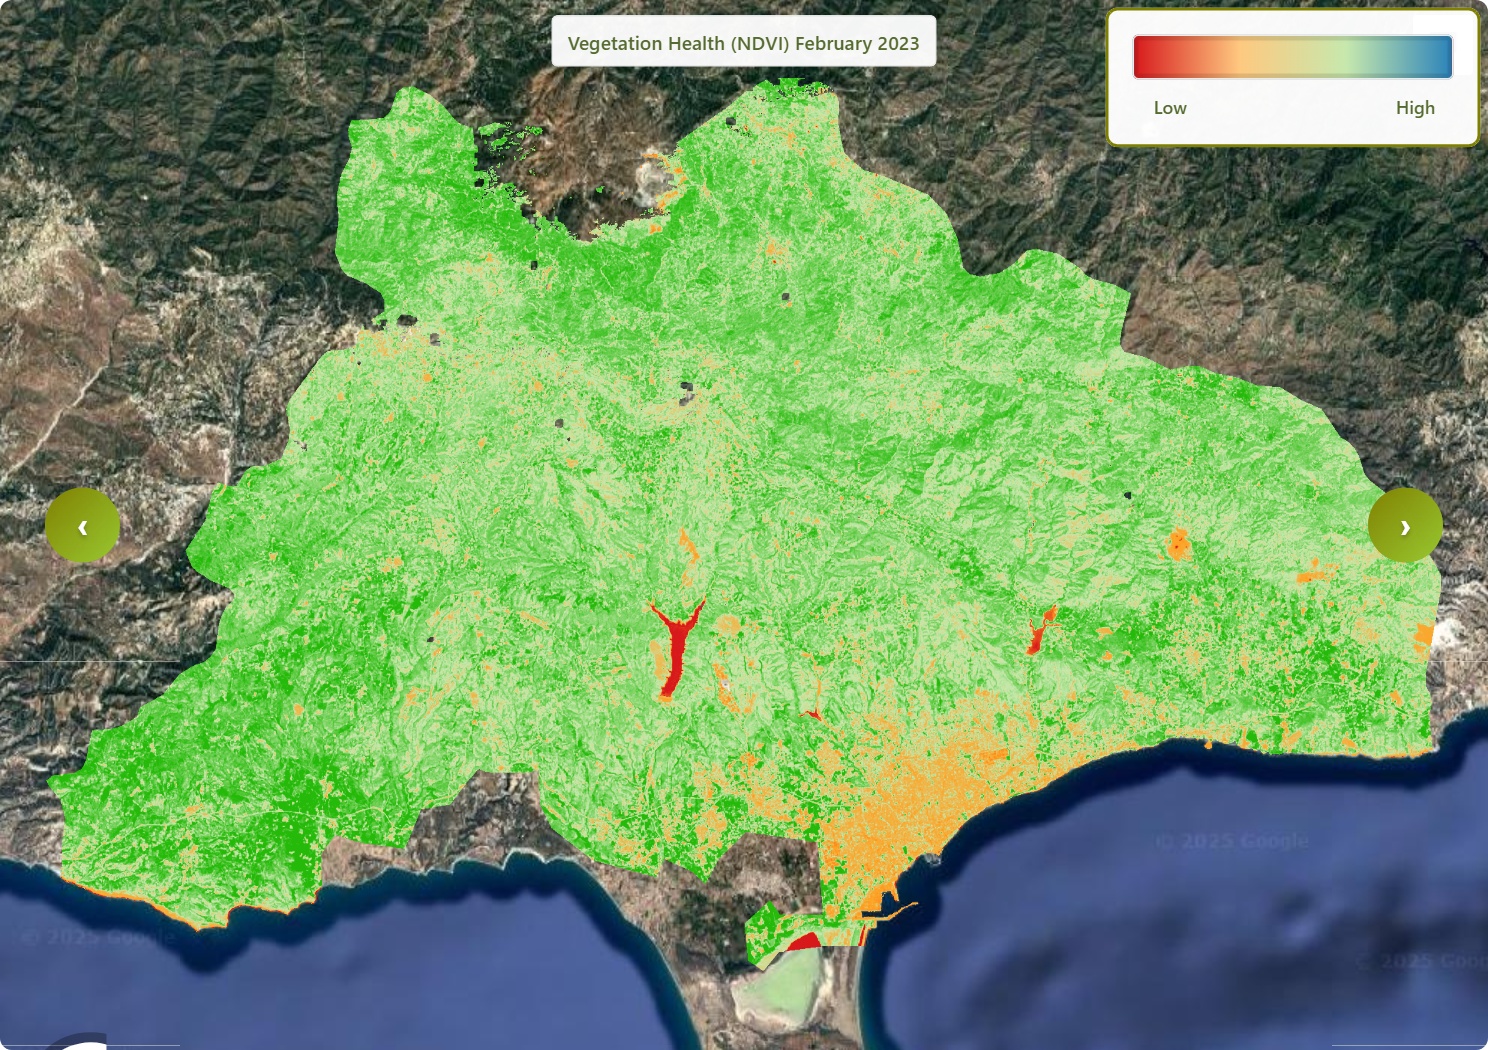
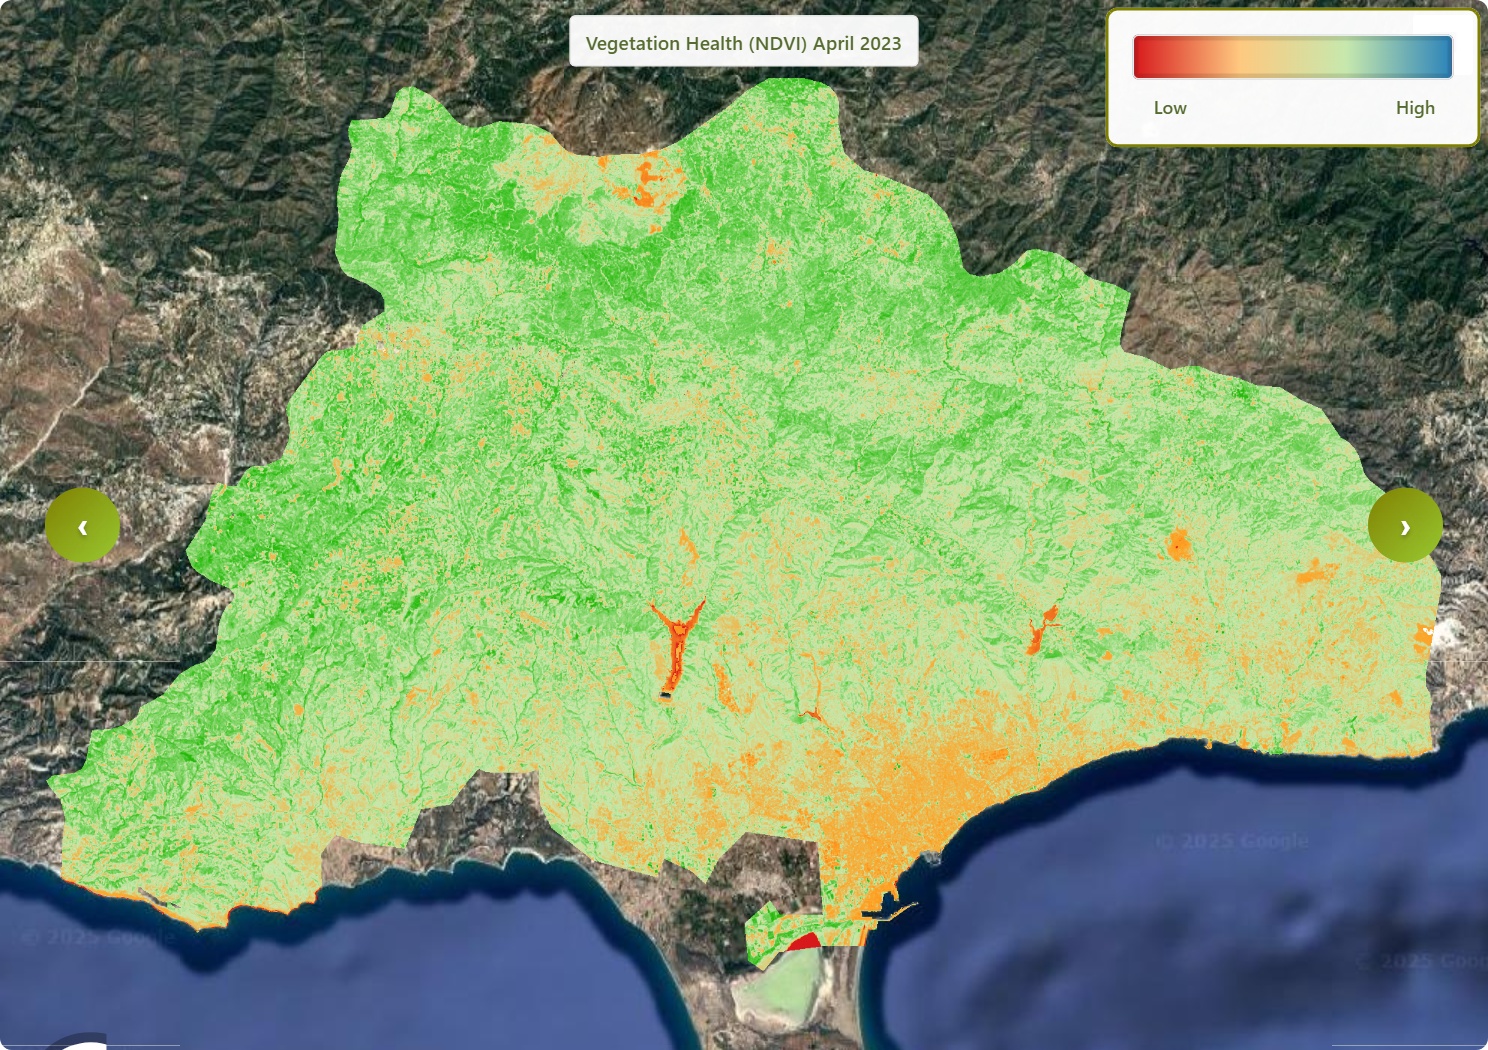
Fig no
This map (Fig. no) illustrates the fire risk categories in Limassol. The methodology used assesses the values of various parameters in each area, categorising them into different risk classes based on these values. The extremely high-risk areas are located in the centre of Limassol due to the parameters assessed and historical fire data. Regions that have experienced wildfires in the past are more vulnerable to future fires because of declines in vegetation health, soil moisture, and plant moisture.

When discussing risk levels, the central part of Limassol falls under high and extremely high risk. In contrast, the northern part is categorised as having no risk due to the healthy vegetation present there. The health of the vegetation is robust, with a significant amount of plant moisture. Additionally, the presence of forests and healthy vegetation helps maintain lower ground temperatures, which contributes to the no-risk classification for the northern areas. These factors collectively explain why the northern parts of Limassol are designated as a no-risk zone.
Validation.1
Predicted Fire risk Areas VS Actual fire area.

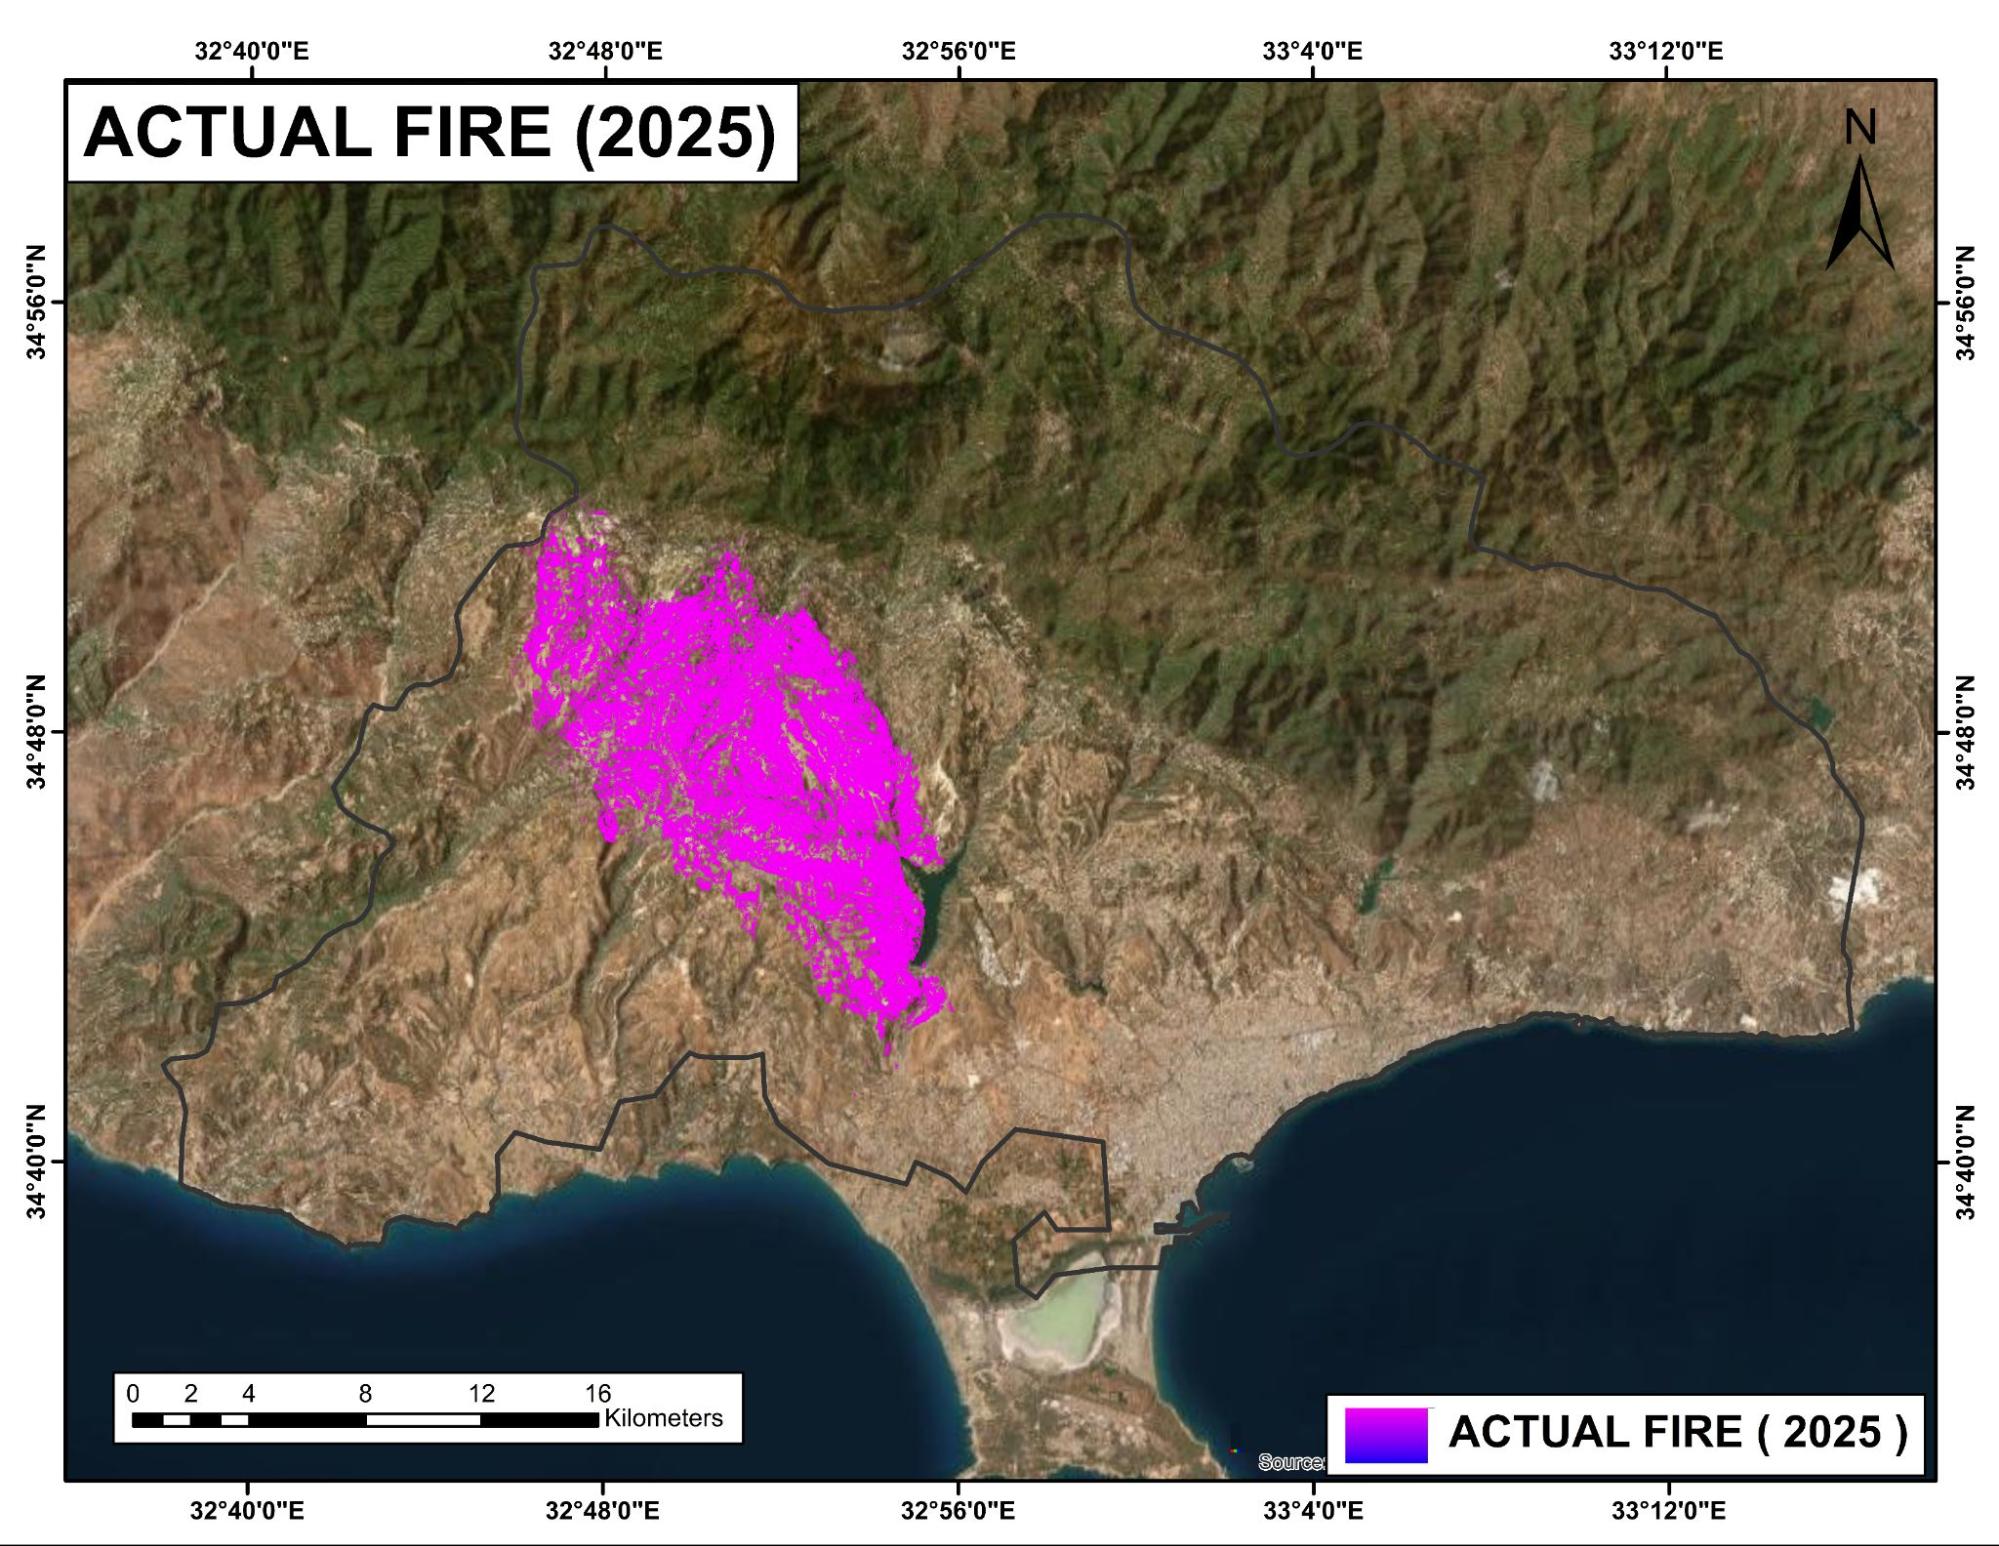
- Predicted Fire Area for the 2025 (b) Actual fire area in 2025
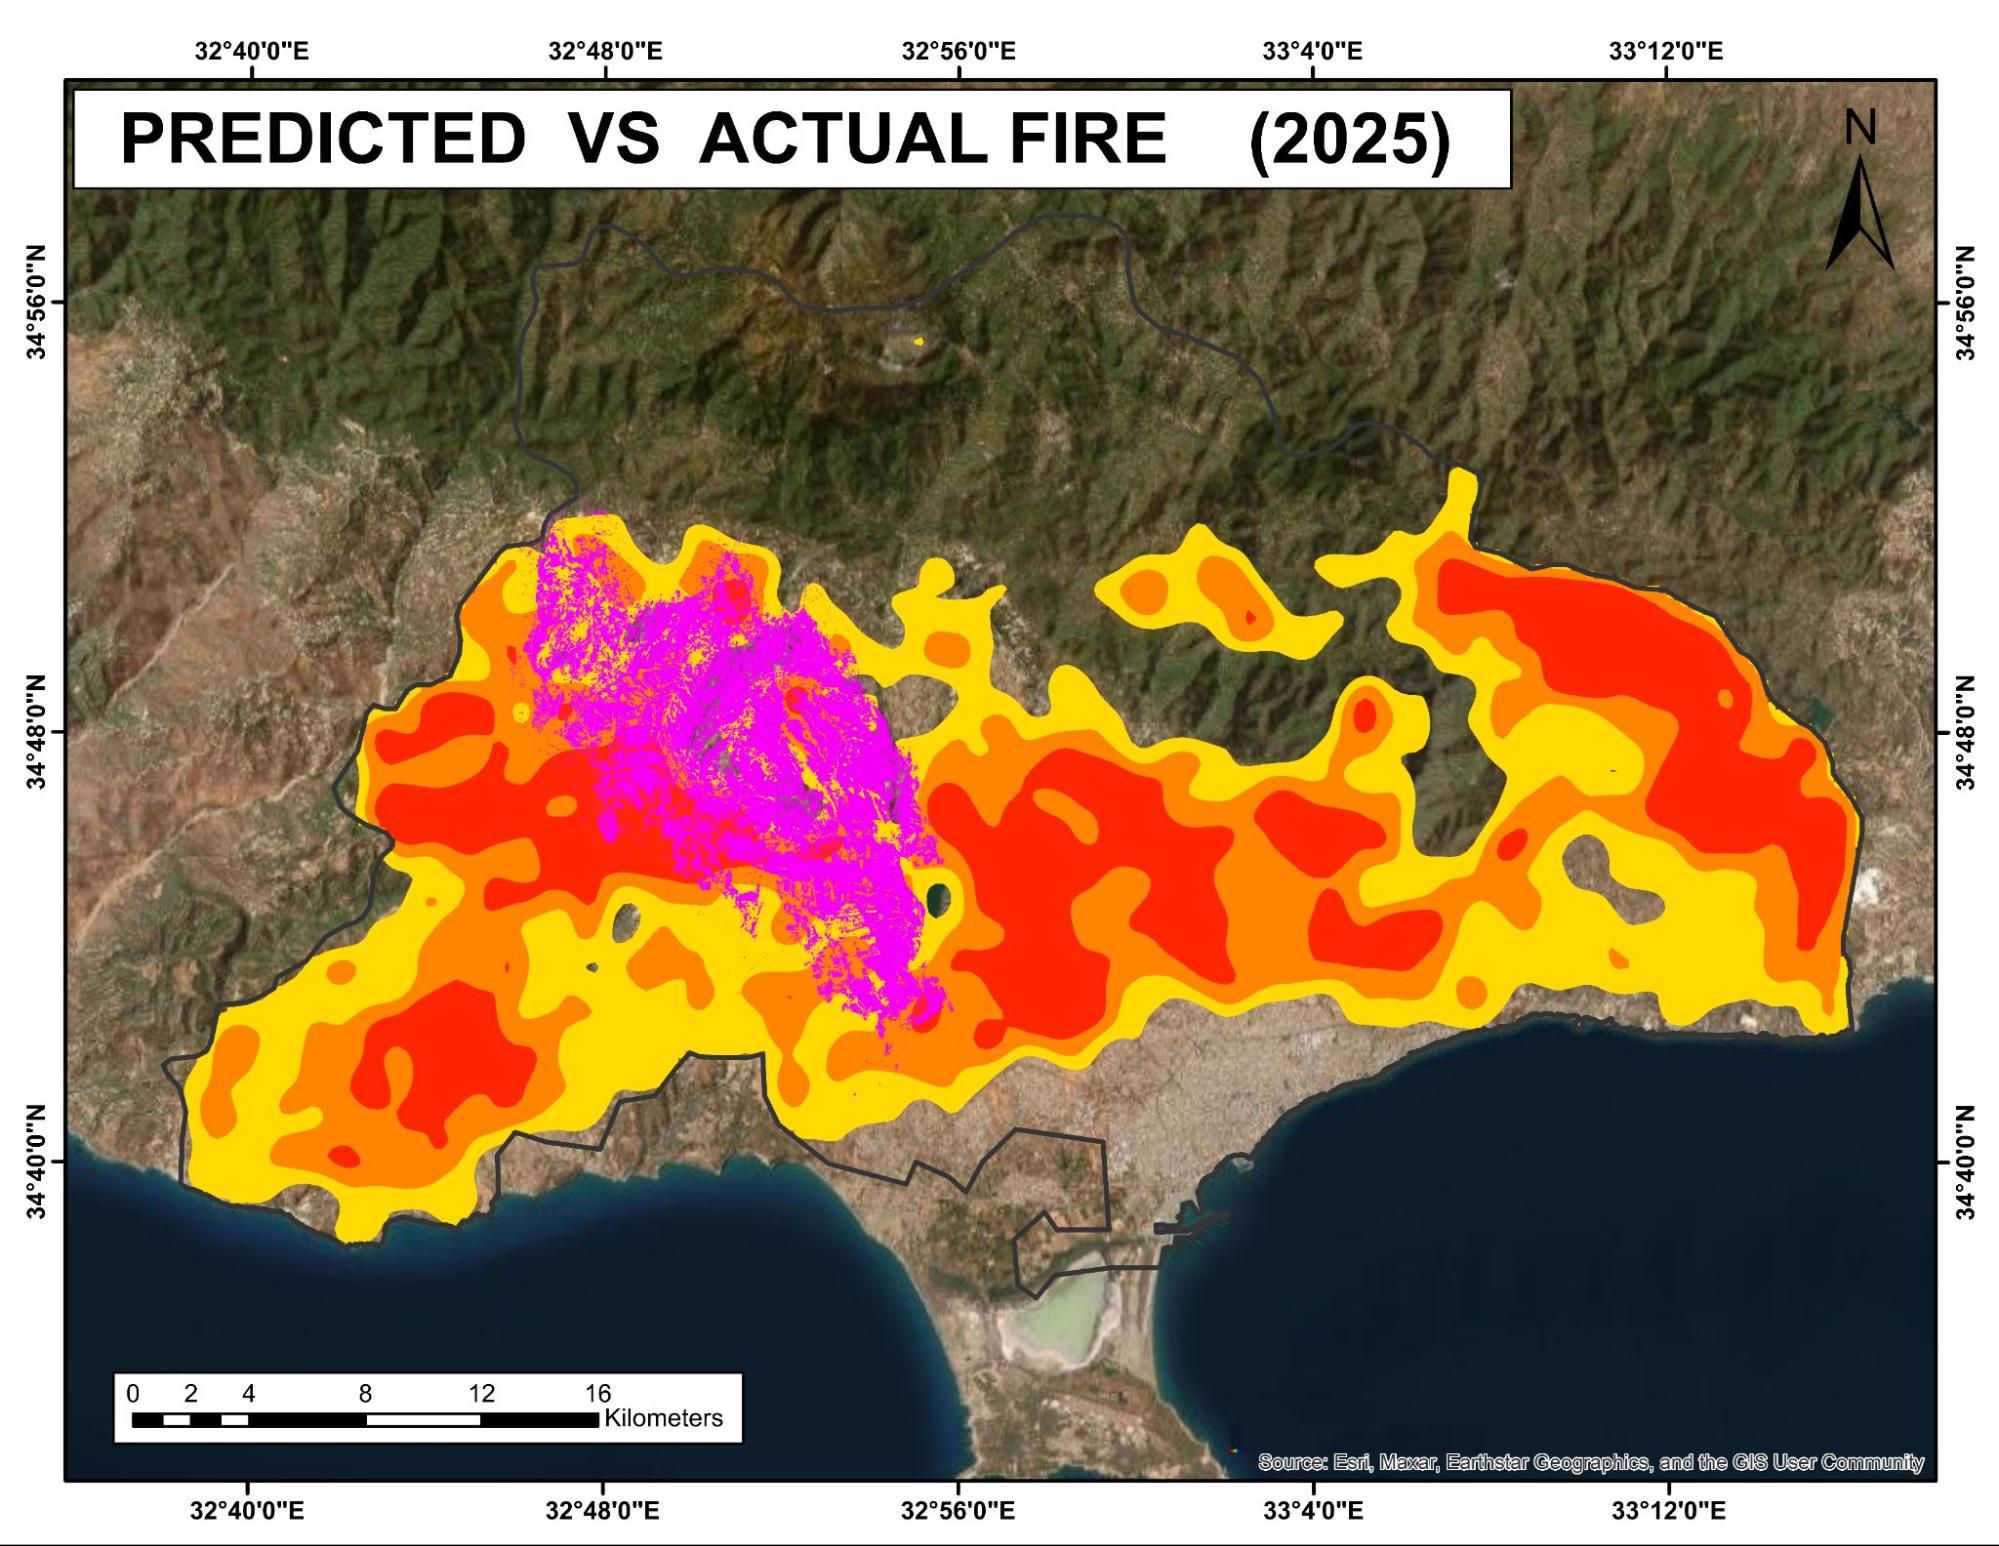
(c ) This map illustrates the predicted versus actual fire area for 2025, validating that the methodology is accurate and yields reliable results.
Figure No: This figure illustrates that the methodology used produces accurate results. In Figure (a), we see the predicted fire risk areas for 2025, while Figure (b) displays the actual fire areas for 2025. When we align both figures together, Figure (c) clearly shows that all actual fire areas fall within the predicted fire risk areas. This indicates that our predictions and methodology were indeed correct.
Validation 2.
A total of 13 villages were severely affected during the Limassol 2025 wildfire, making it one of the district’s most destructive disasters in recent years. Communities such as Souni-Zanakia, Agios Therapontas, Lofou, Vouni, Malia, Omodos, Alassa, Arsos, Kivides, Pera Pedi, Monagri, Potamiou, and Vasa Koilaniou experienced extensive damage to homes, farmland, forest areas, and local infrastructure. Many residents were evacuated as the fast-moving flames swept across the hills, destroying vegetation and threatening livelihoods. These villages now face a long recovery period as authorities work to assess losses, restore essential services, and rebuild what was destroyed.
https://cyprus-mail.com/2025/07/24/inferno-devastates-villages-in-limassol?utm_source=chatgpt.com
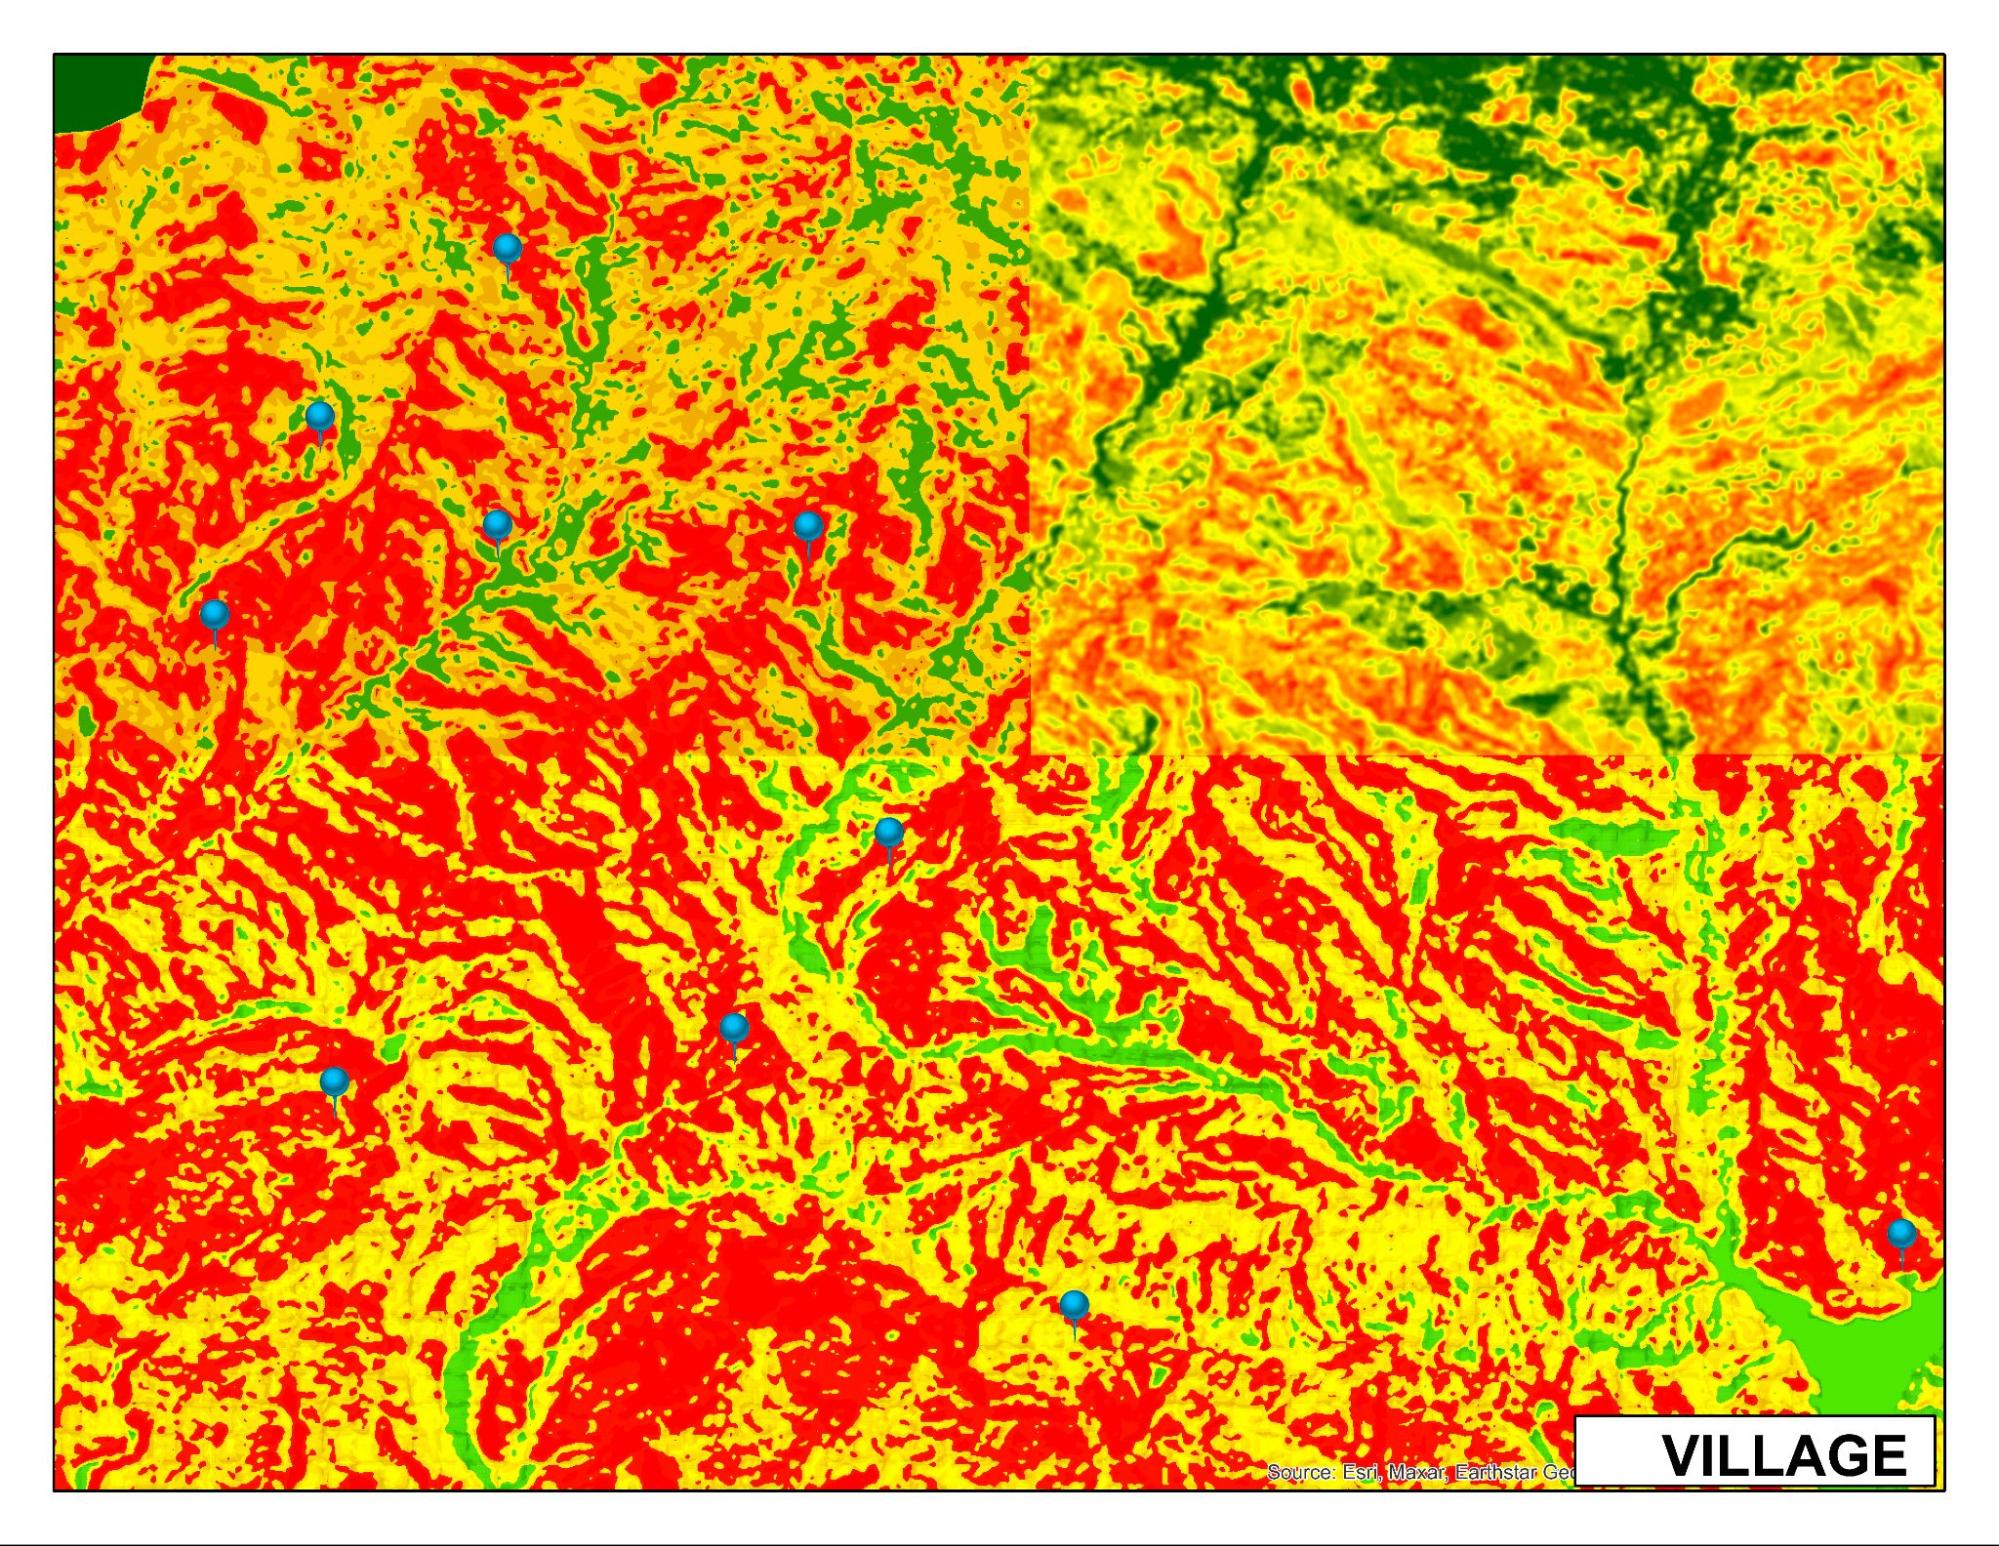
Fig. no:- This image shows the location of villages in the very high-risk area in the predicted fire risk area of Limassol for the 2025 wildfire.
It is clear that the 13 villages were mostly affected by the Limassol wildfire in 2025. Out of these 13 villages, 12 fall within the very high-risk zones identified in our predictive map for the Limassol wildfire of 2025. This indicates that our predictions and methodology are accurate, yielding results with a high degree of reliability.
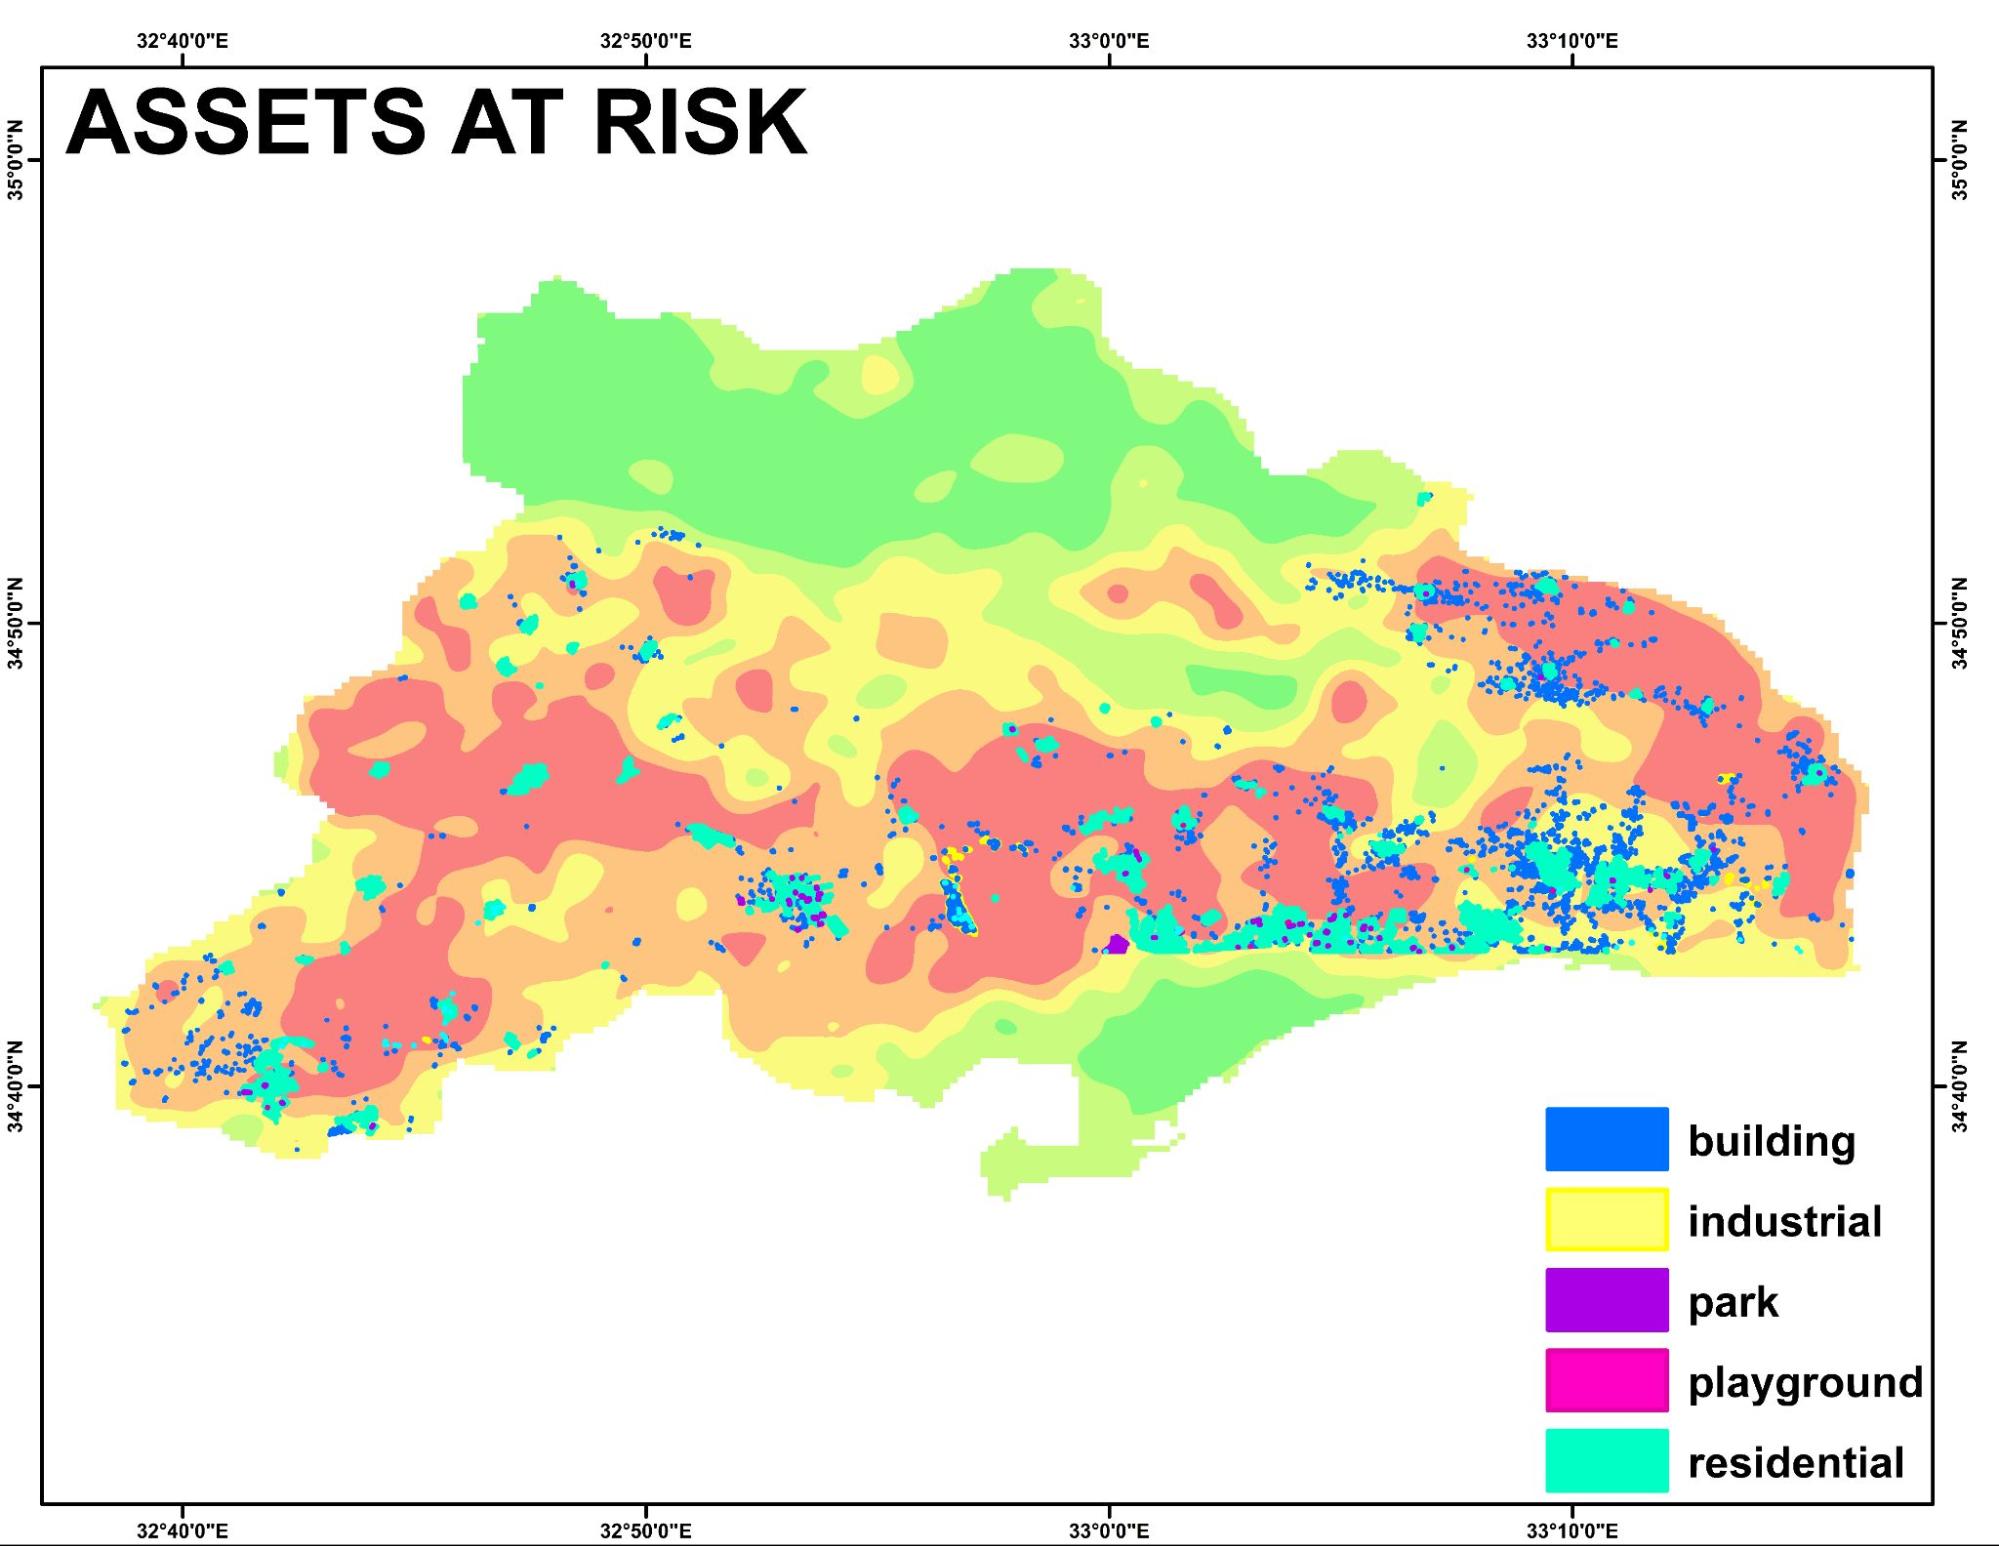
Assets at risk.
 |
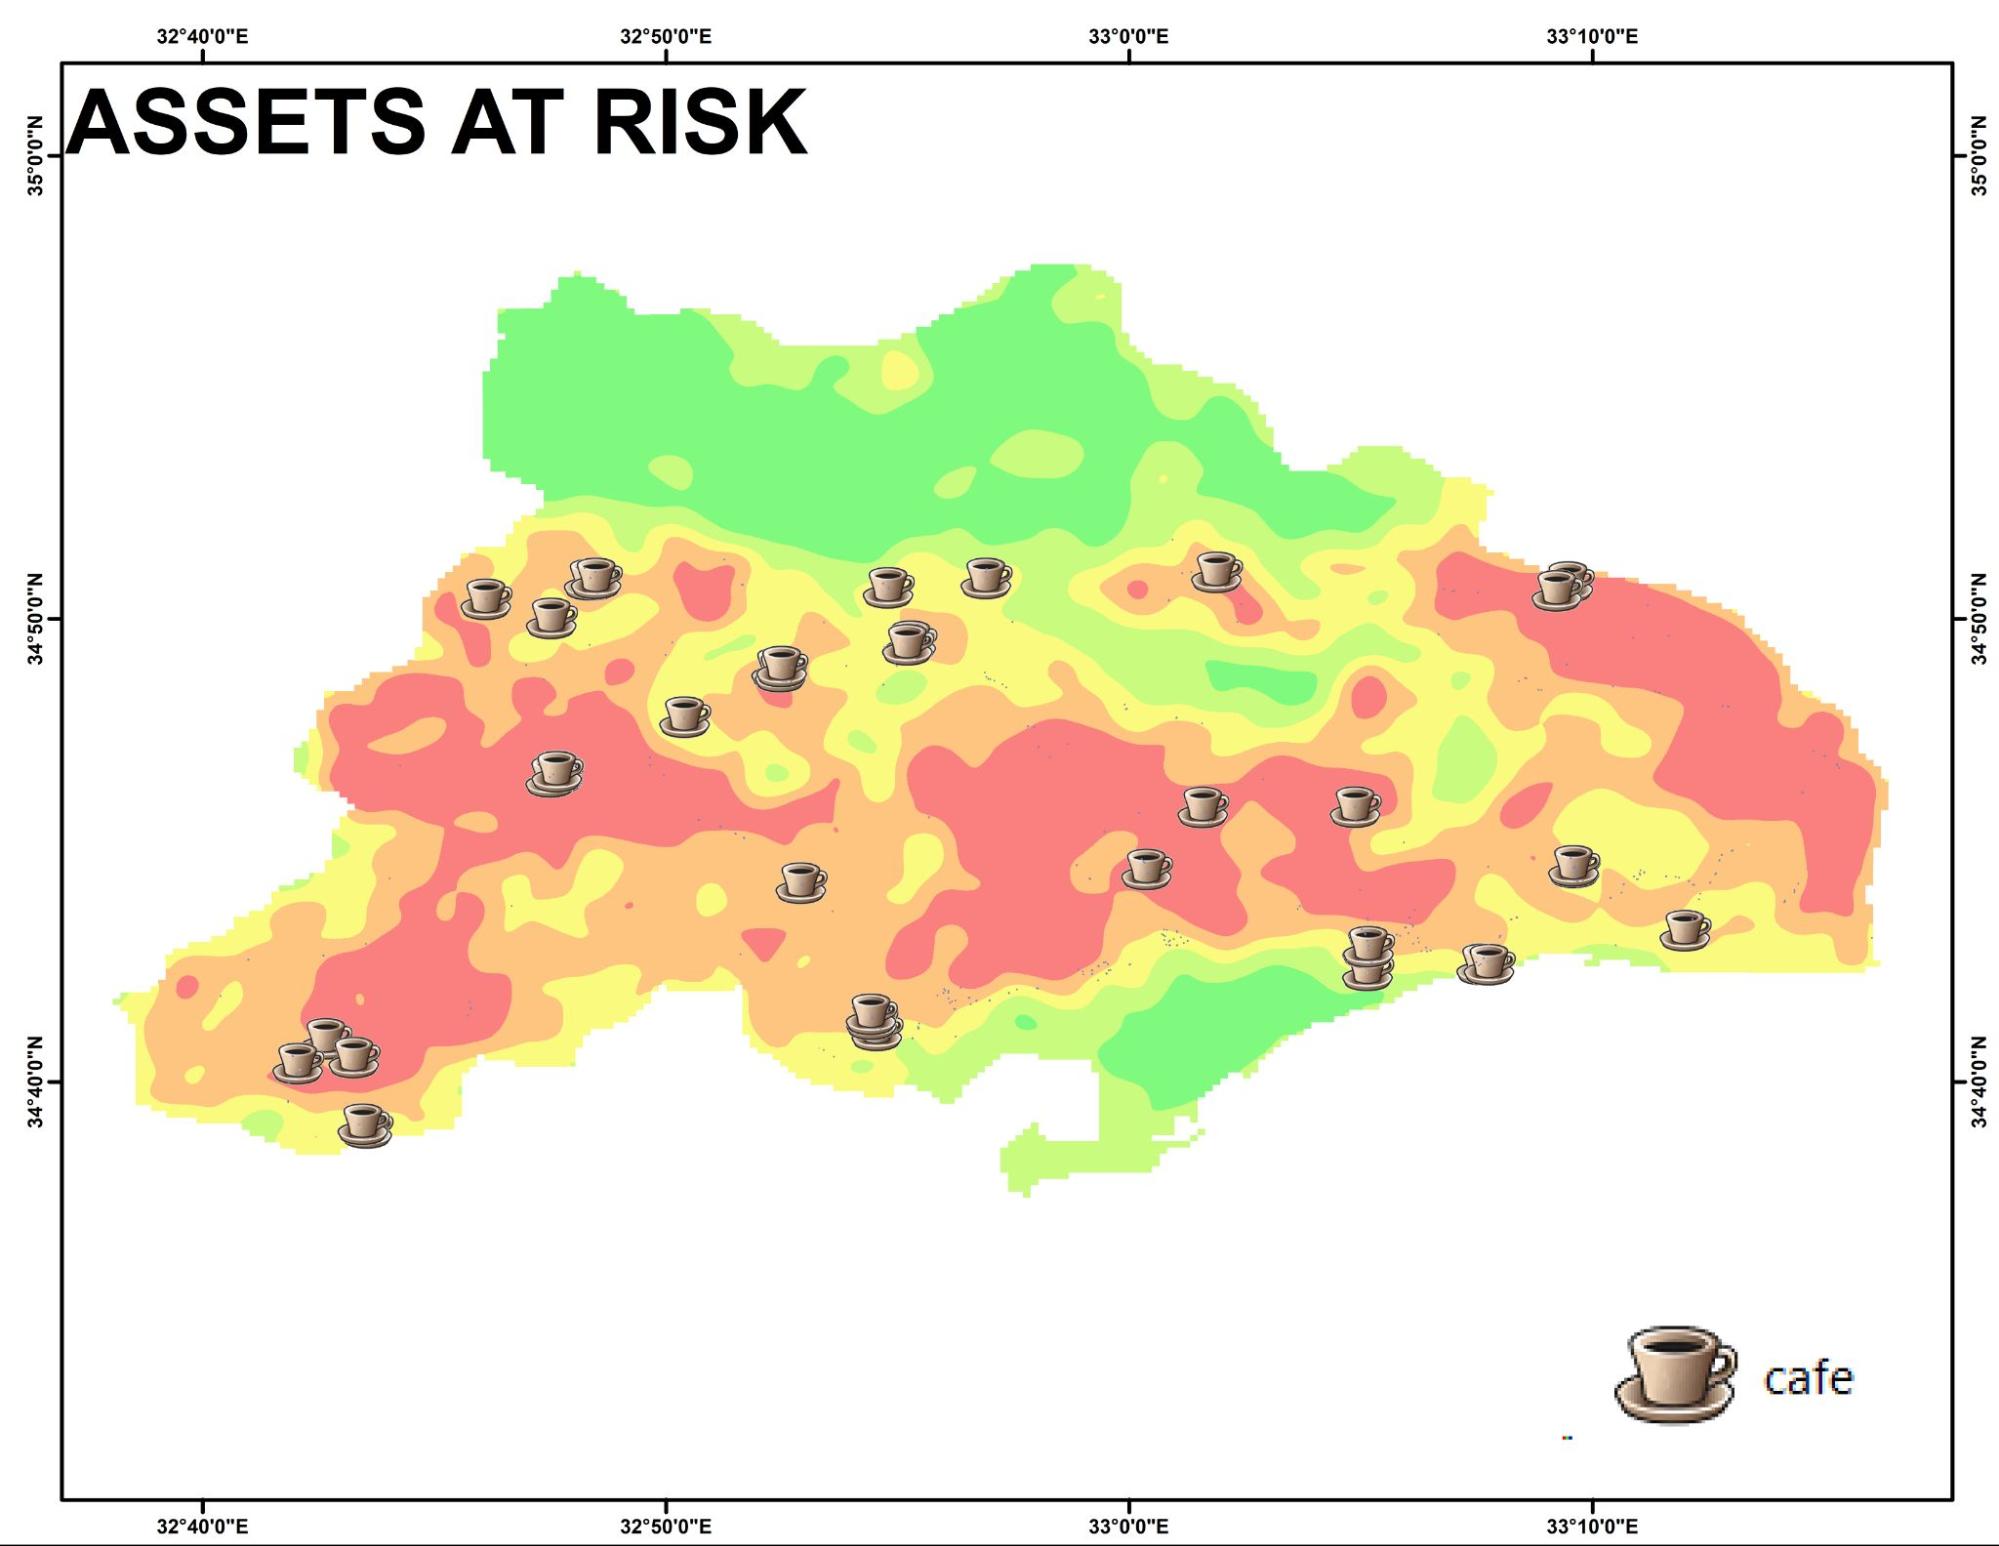 |
| Bus Stops that come under high risk. | Cafe that come under high risk. |
 |
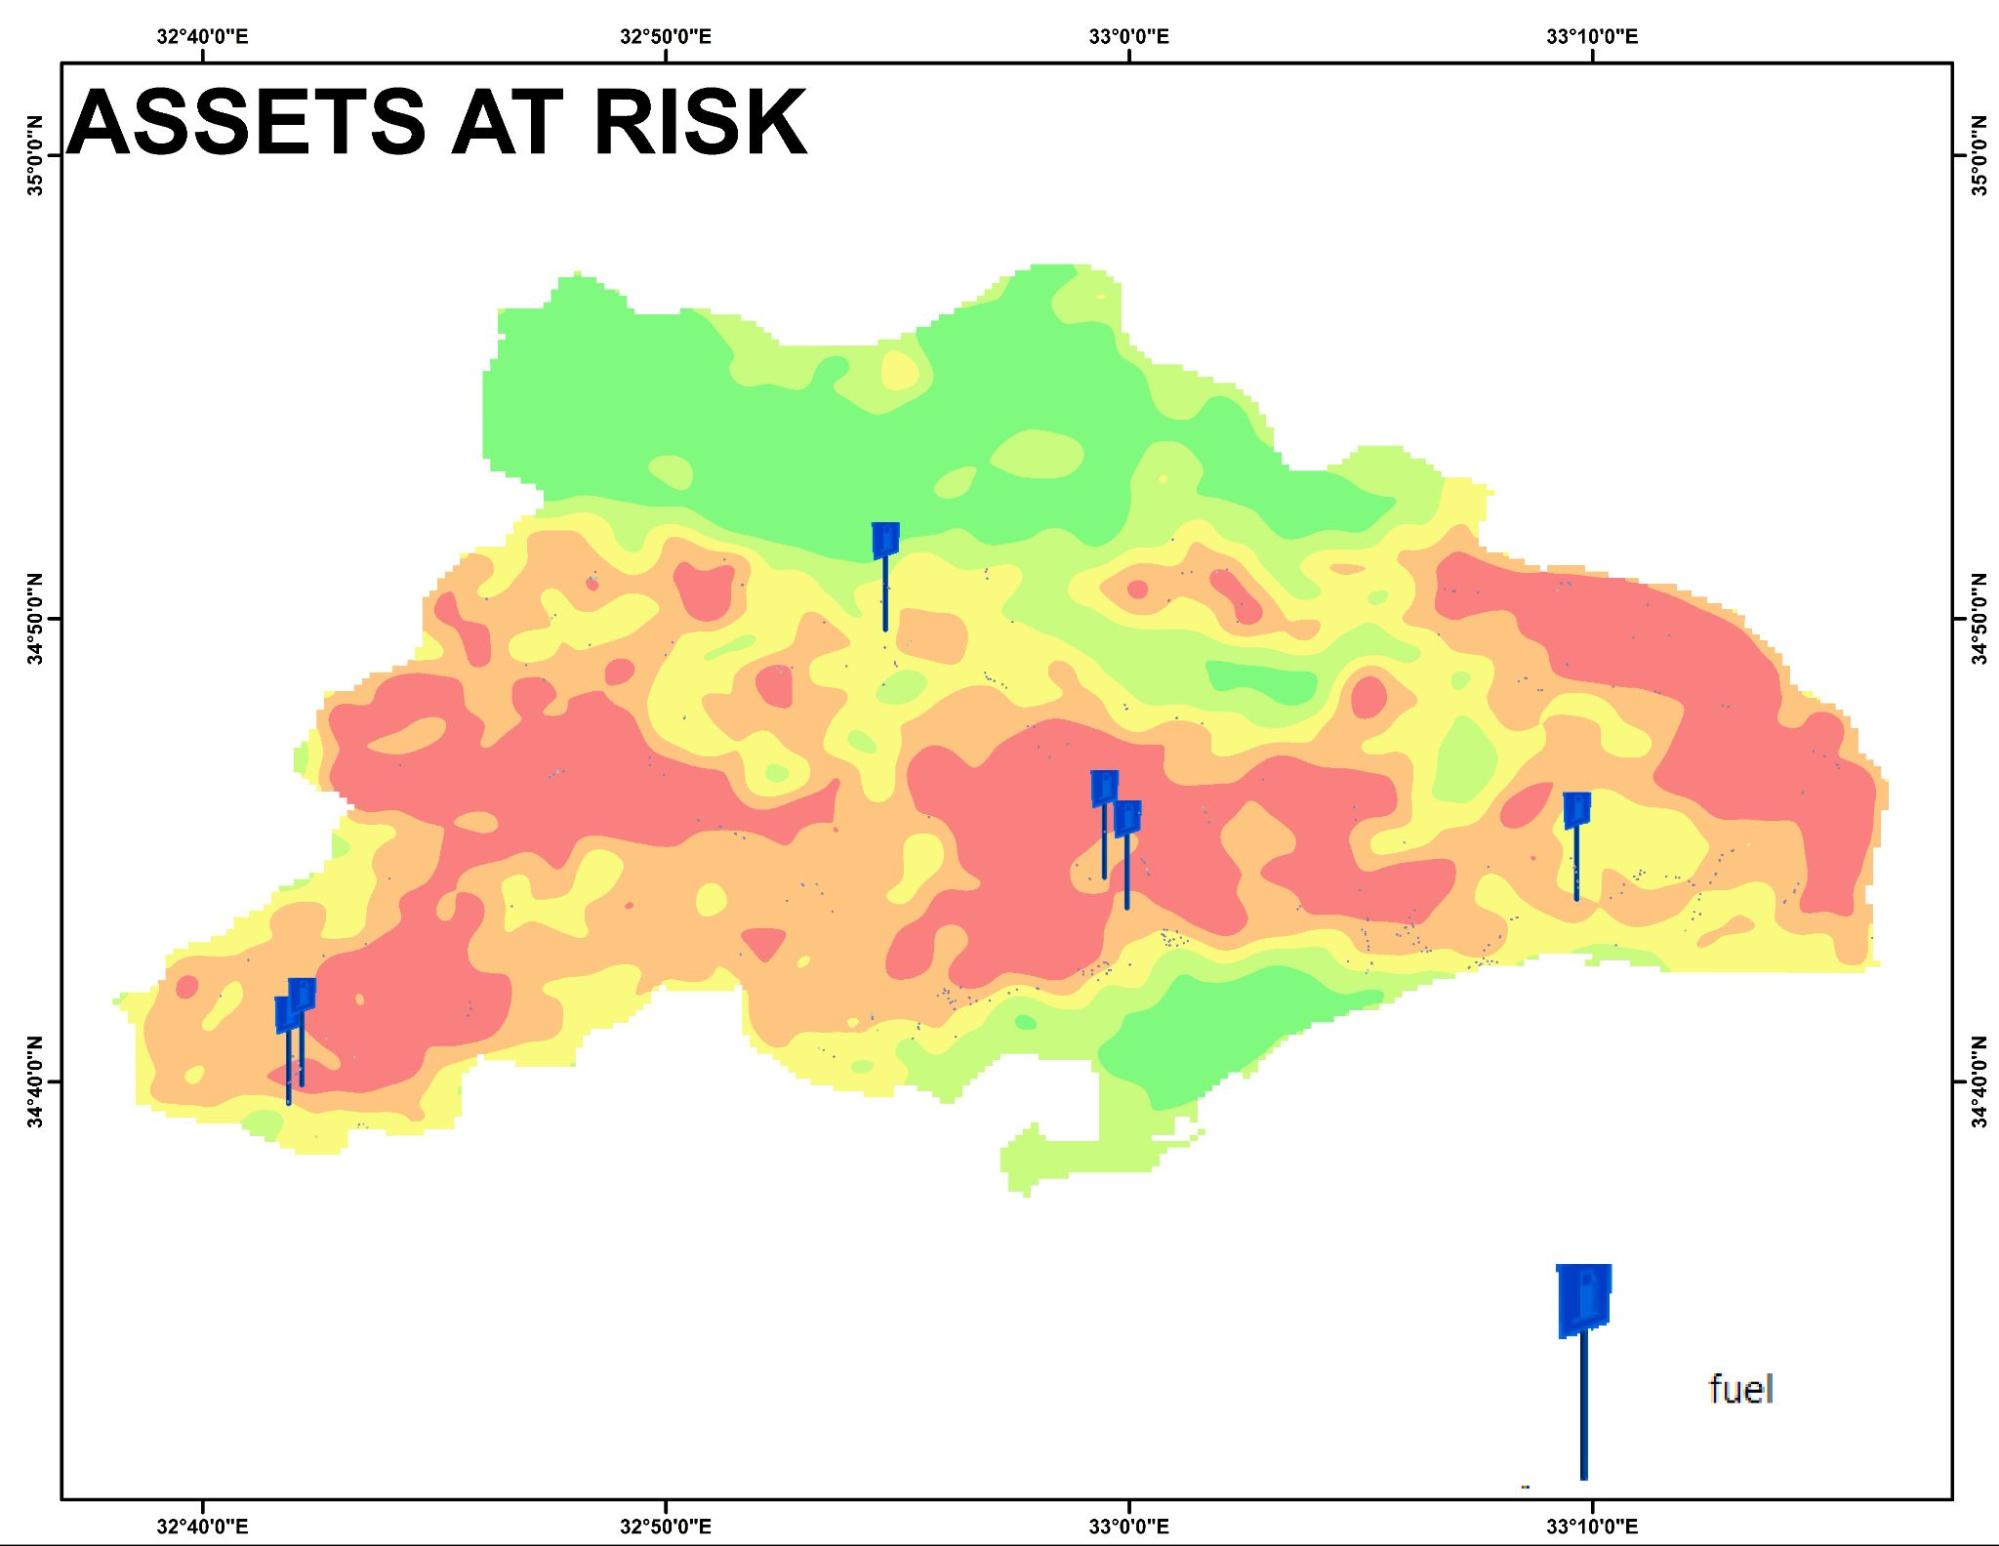 |
| Bank that come under high risk. | Fuel Stations that come under high risk. |
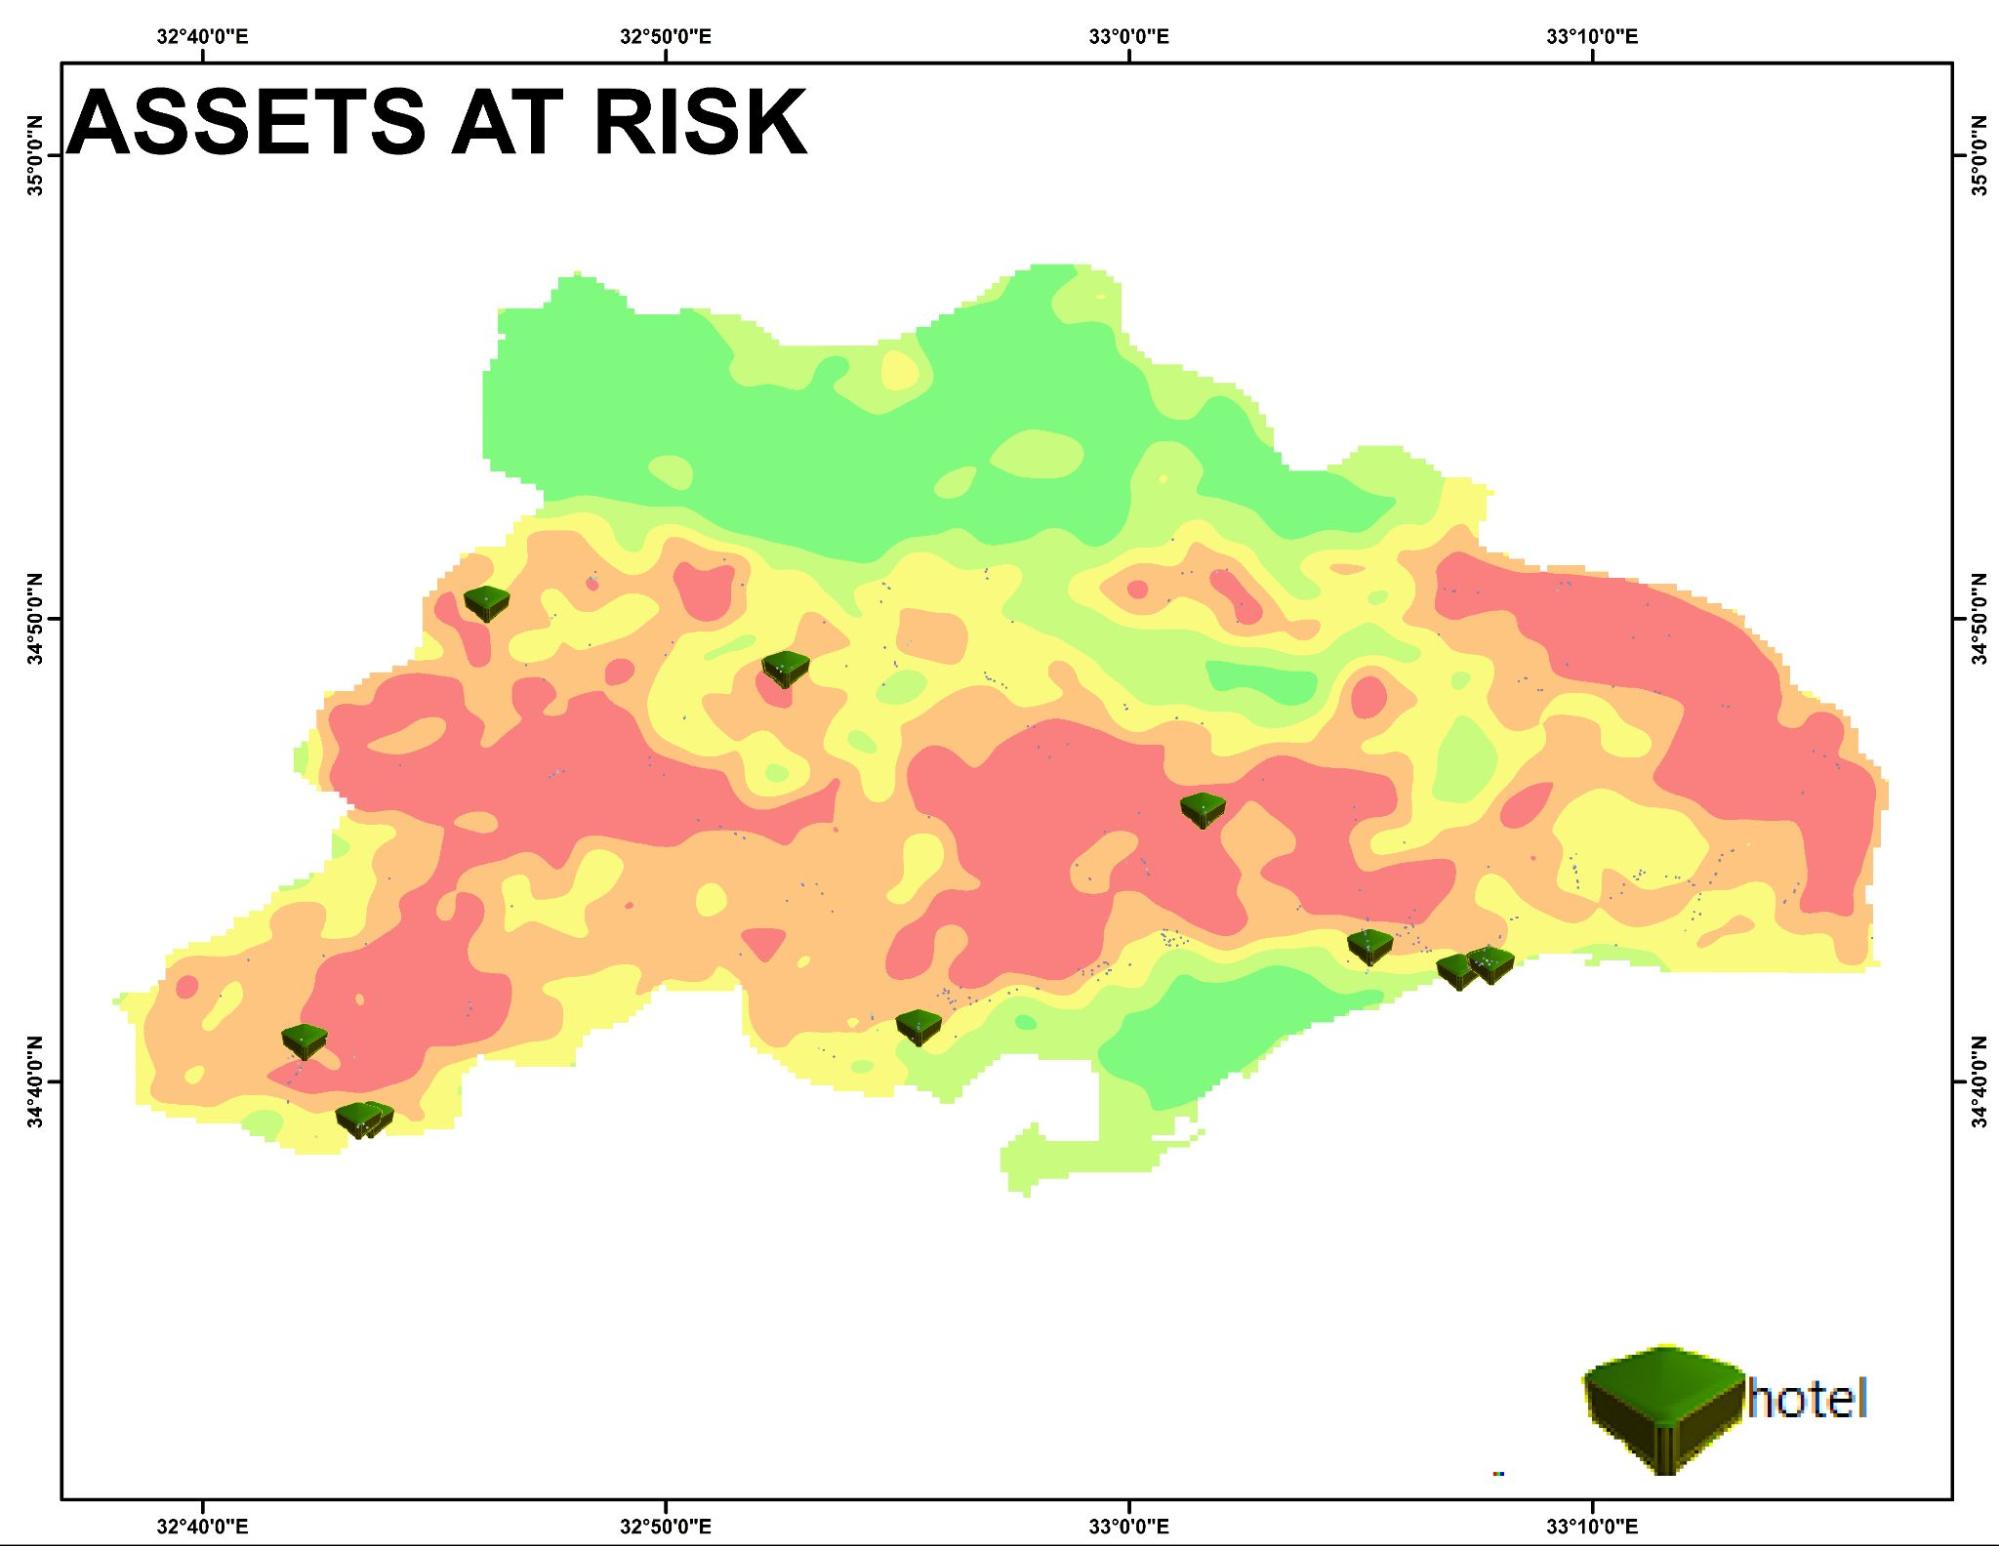 |
 |
| Hotels that come under high risk. | Restaurants that come under high risk. |
 |
 |
| Schools that come under high risk. | Villages that come under high risk. |
 |
 |
| These assets come under high risk. | These assets come under high risk. |
| ASSET | NUMBER | ASSET | NUMBER | ASSET | NUMBER |
| golf_course | 1 | building | 11709 | ruins | 7 |
| park | 118 | chalet | 1 | atm | 7 |
| pitch | 83 | county | 1 | bakery | 9 |
| playground | 8 | residential | 130 | bank | 7 |
| sports_centre | 9 | village | 4 | bar | 5 |
| stadium | 6 | cemetery | 31 | beverages | 2 |
| swimming_pool | 220 | graveyard | 31 | butcher | 4 |
| track | 5 | hospital | 2 | cafe | 44 |
| bar | 2 | kindergarten | 4 | clothes | 3 |
| cafe | 4 | library | 1 | convenience | 17 |
| car_wash | 2 | museum | 1 | doityourself | 2 |
| clothes | 1 | post_office | 1 | fuel | 6 |
| convenience | 3 | school | 26 | garden_centre | 3 |
| doityourself | 1 | shelter | 3 | gift_shop | 4 |
| hairdresser | 1 | town_hall | 4 | greengrocer | 1 |
| hotel | 2 | veterinary | 1 | hairdresser | 3 |
| recycling | 2 | beach | 2 | jeweller | 2 |
| restaurant | 6 | forest | 19 | library | 1 |
| christian | 58 | fountain | 3 | museum | 10 |
| muslim | 1 | island | 1 | optician | 1 |
| ruins | 2 | nature_reserve | 2 | chalet | 7 |
| theatre | 2 | industrial | 31 | guesthouse | 6 |
| commercial | 1 | hamlet | 11 | hostel | 1 |
| farmland | 161 | locality | 3 | hotel | 12 |
| Farmyard | 87 | town | 1 | park | 2 |
| vineyard | 201 | village | 61 | pitch | 14 |
| doctors | 1 | shelter | 9 | playground | 38 |
| hospital | 1 | vending_any | 1 | clinic | 2 |
| kindergarten | 10 | waste_basket | 18 |
Zoning for High-Risk Areas
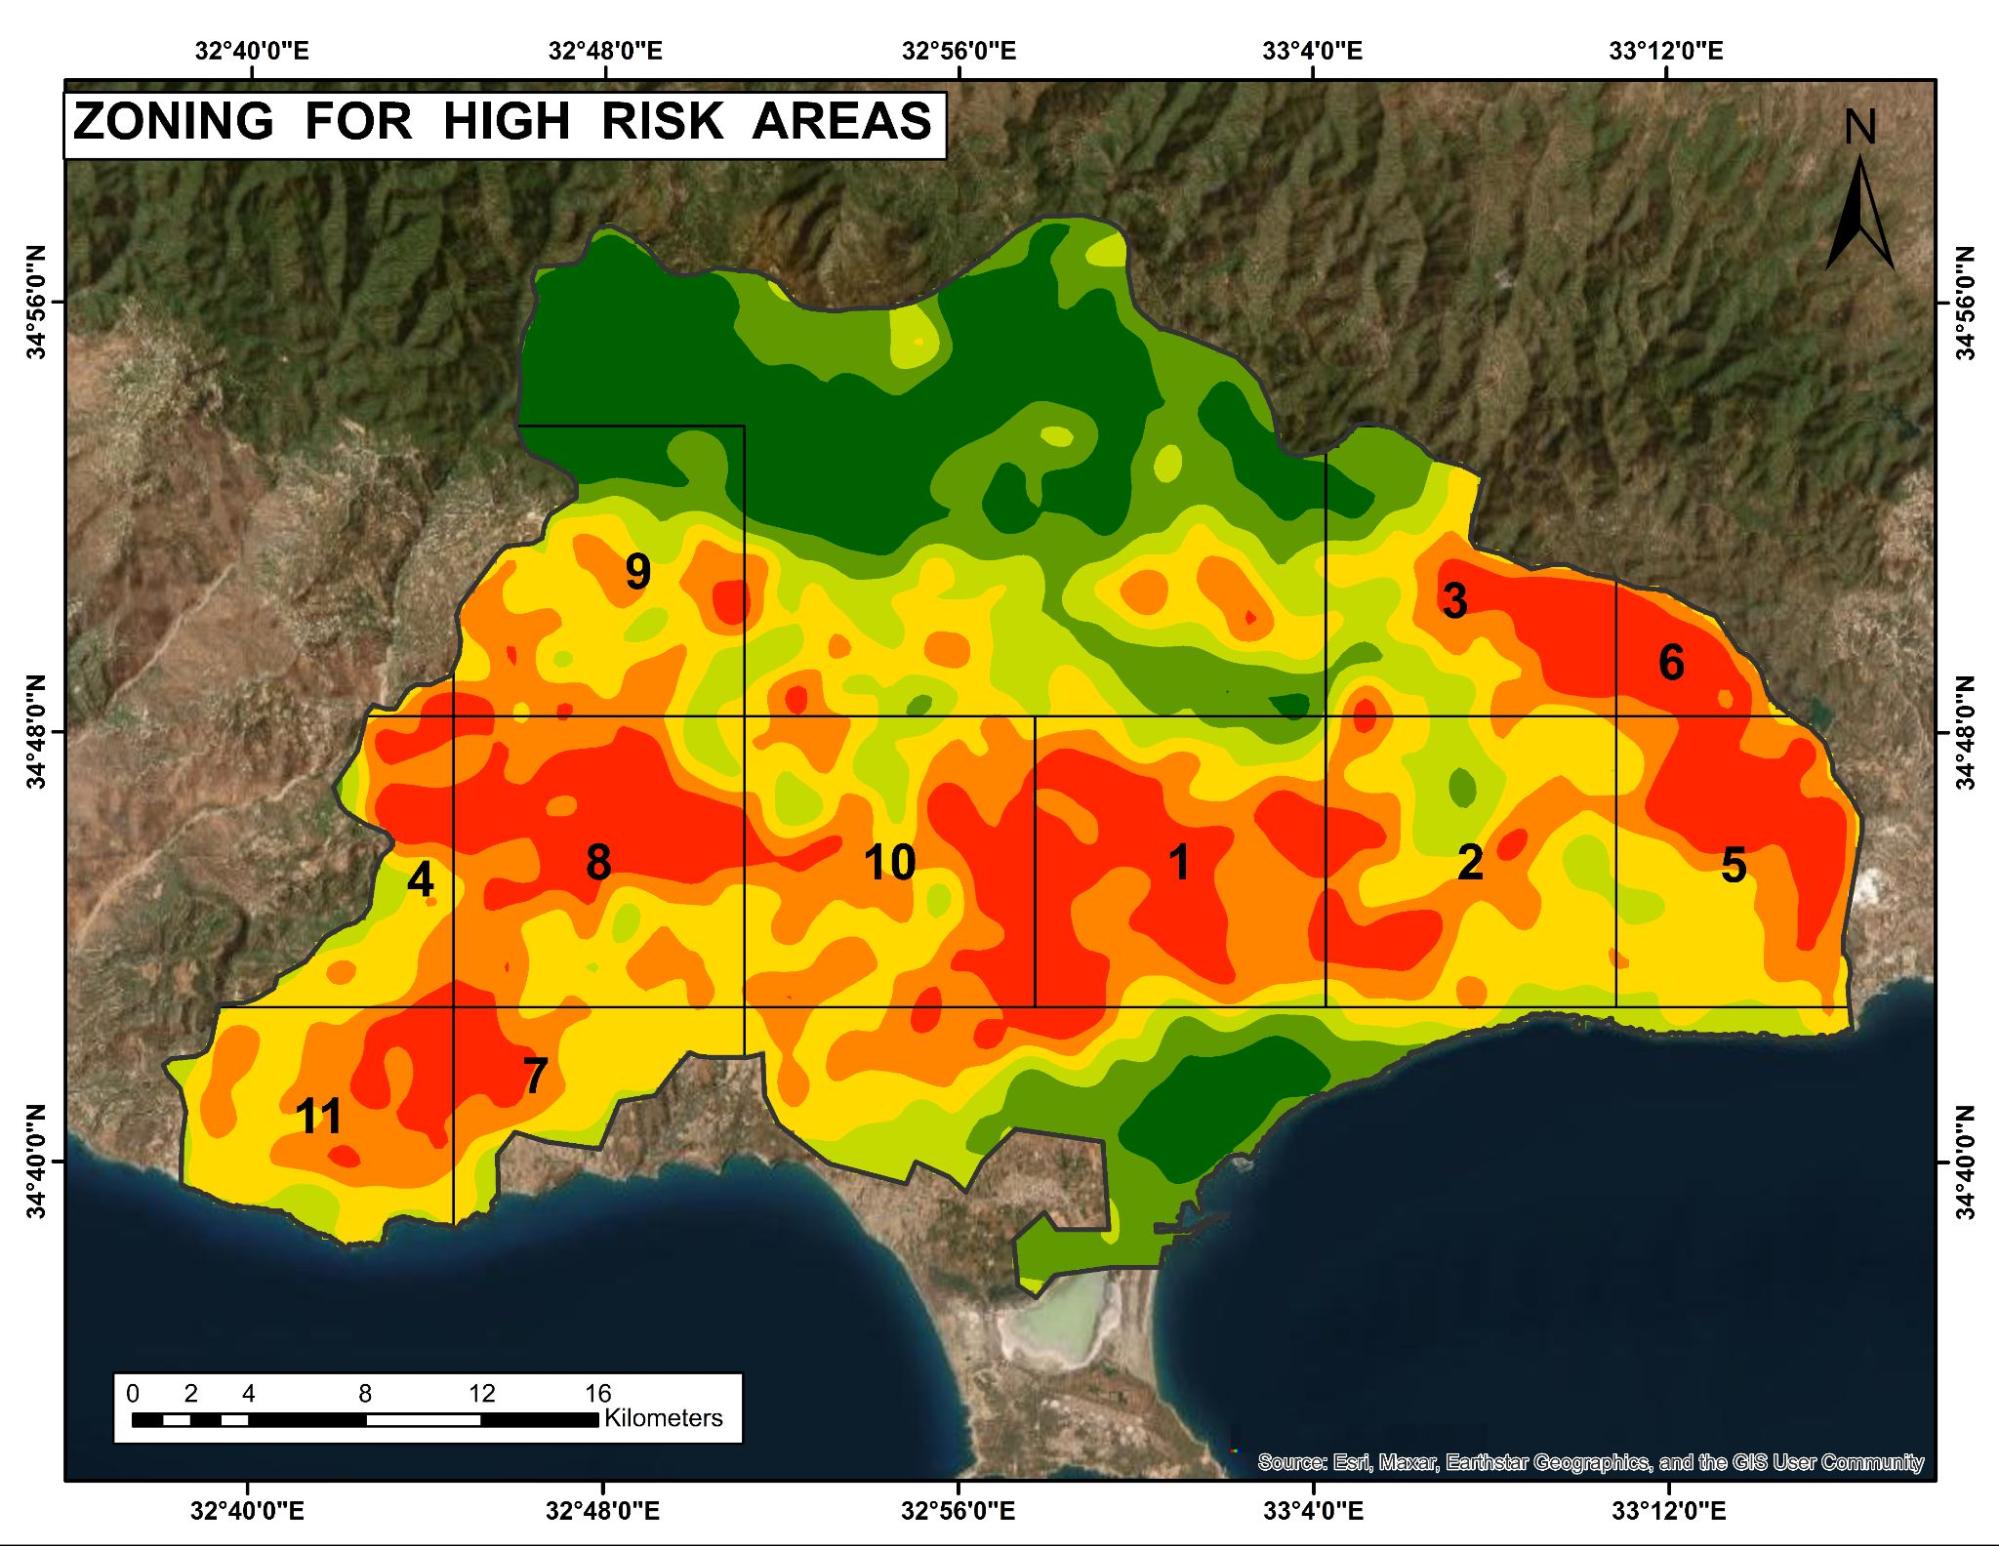
Zoning of the High risk areas have been done to get a detailed analysis of Risk in Limassol which help to get the information about vulnarability toward wildfire spread of the areas, it also helps to get the information about the economics assets which comes under the risk area.
-
ZONE 1 RISK MAP
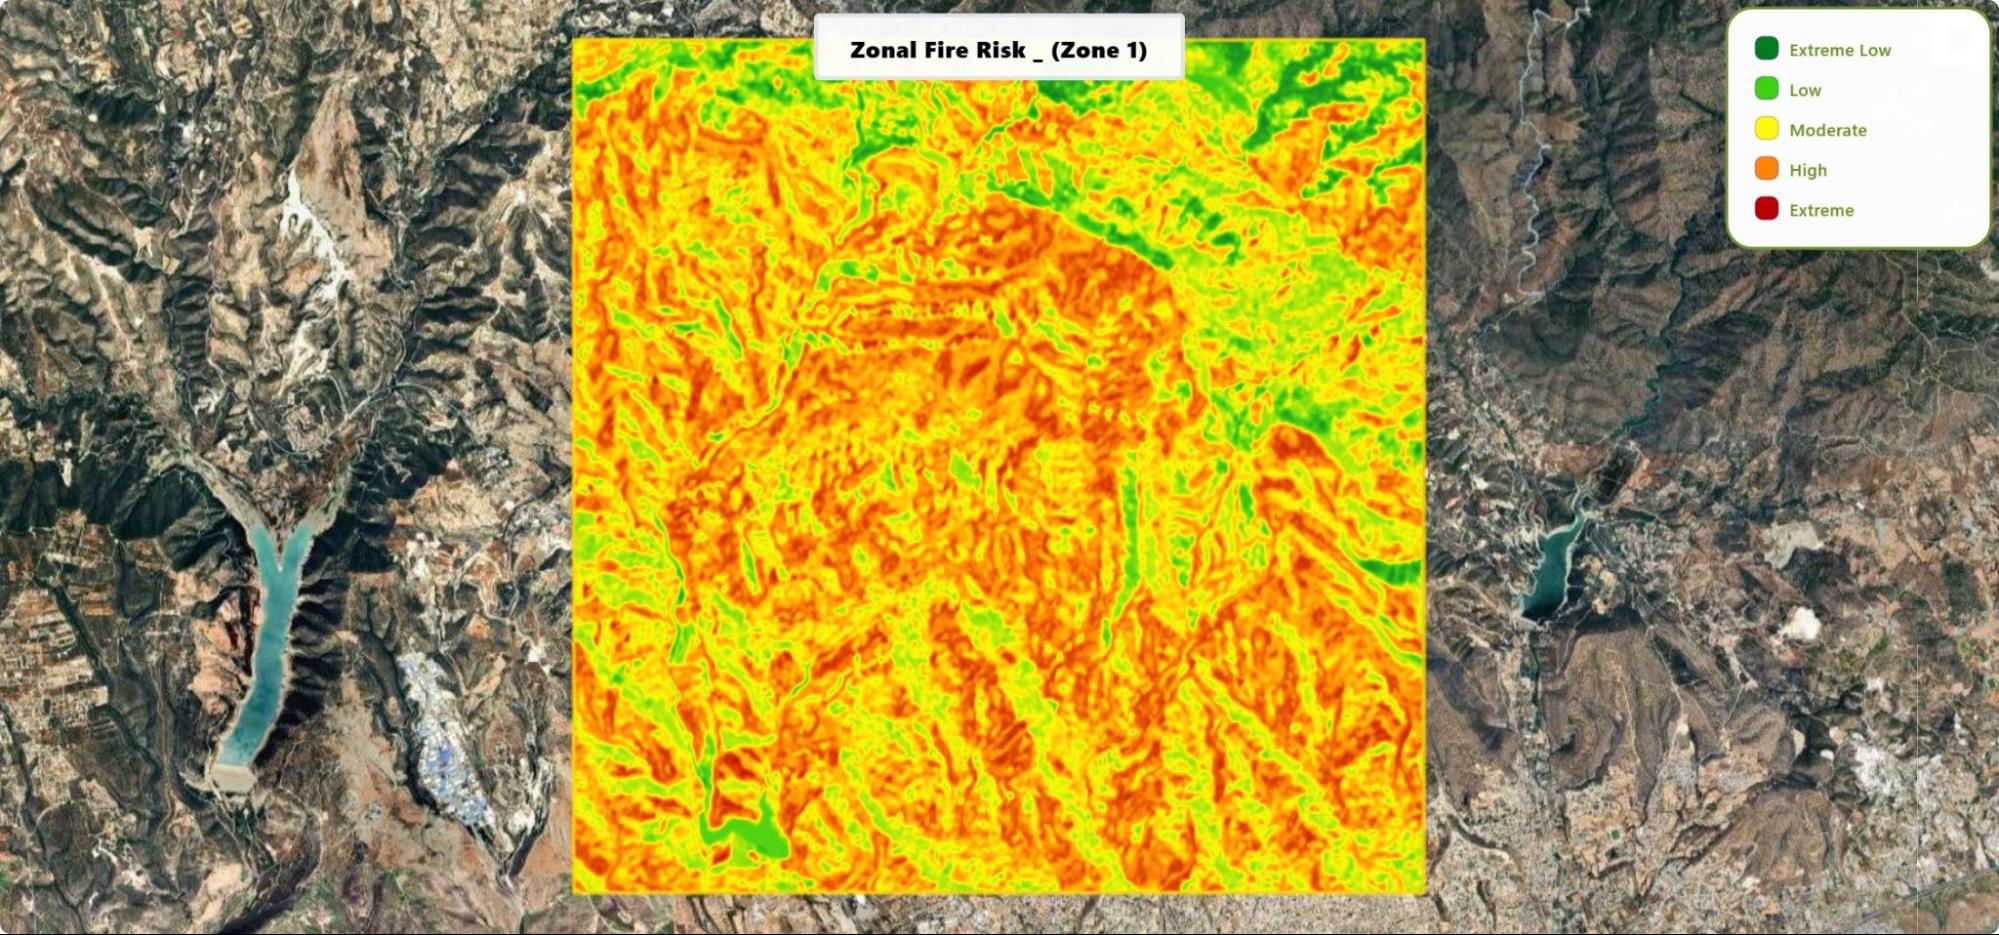
Most of Zone 1 shows high to extreme risk (orange–red) across the central and interior hills, with moderate risk (yellow) forming belts on mid-slopes and around some ridgelines; low to extreme-low risk (light/dark green) appears mainly along valley bottoms, stream corridors, near the small lakes in the southwest and east, and in a few narrow edge pockets.
-
ZONE 2 RISK MAP

Zone 2 shows high–extreme risk (orange–red) across the southern half and much of the east/northeast, moderate risk (yellow) on mid-slopes and interspersed ridges, and low to extreme-low risk (light/dark green) mainly in the broad northern-central belt and along the left-centre valley/reservoir corridor, with a few narrow green pockets elsewhere.
-
ZONE 3 RISK MAP
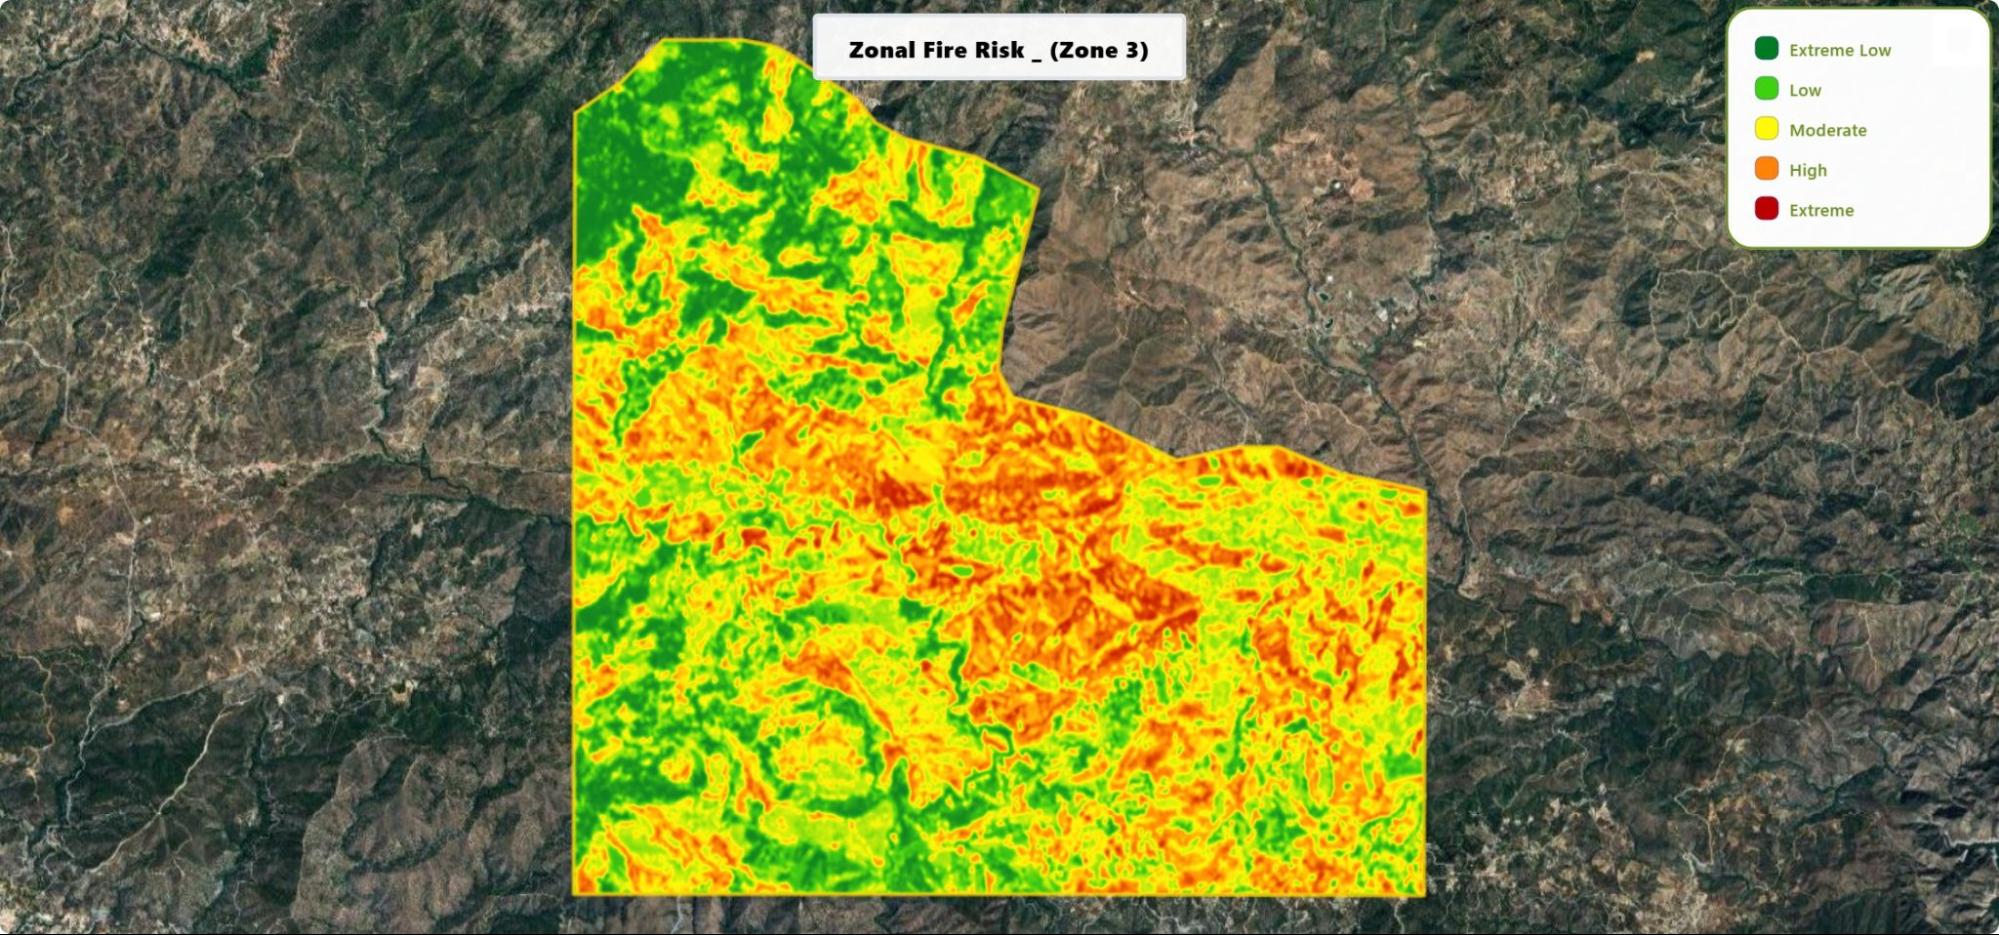
High to extreme risk (orange–red) runs in a broad central east-west band and across the southern hills; moderate (yellow) surrounds these ridges; low to extreme-low (light/dark green) is concentrated in the northern cap and a few valley strips in the south and northeast.
-
ZONE 4 RISK MAP
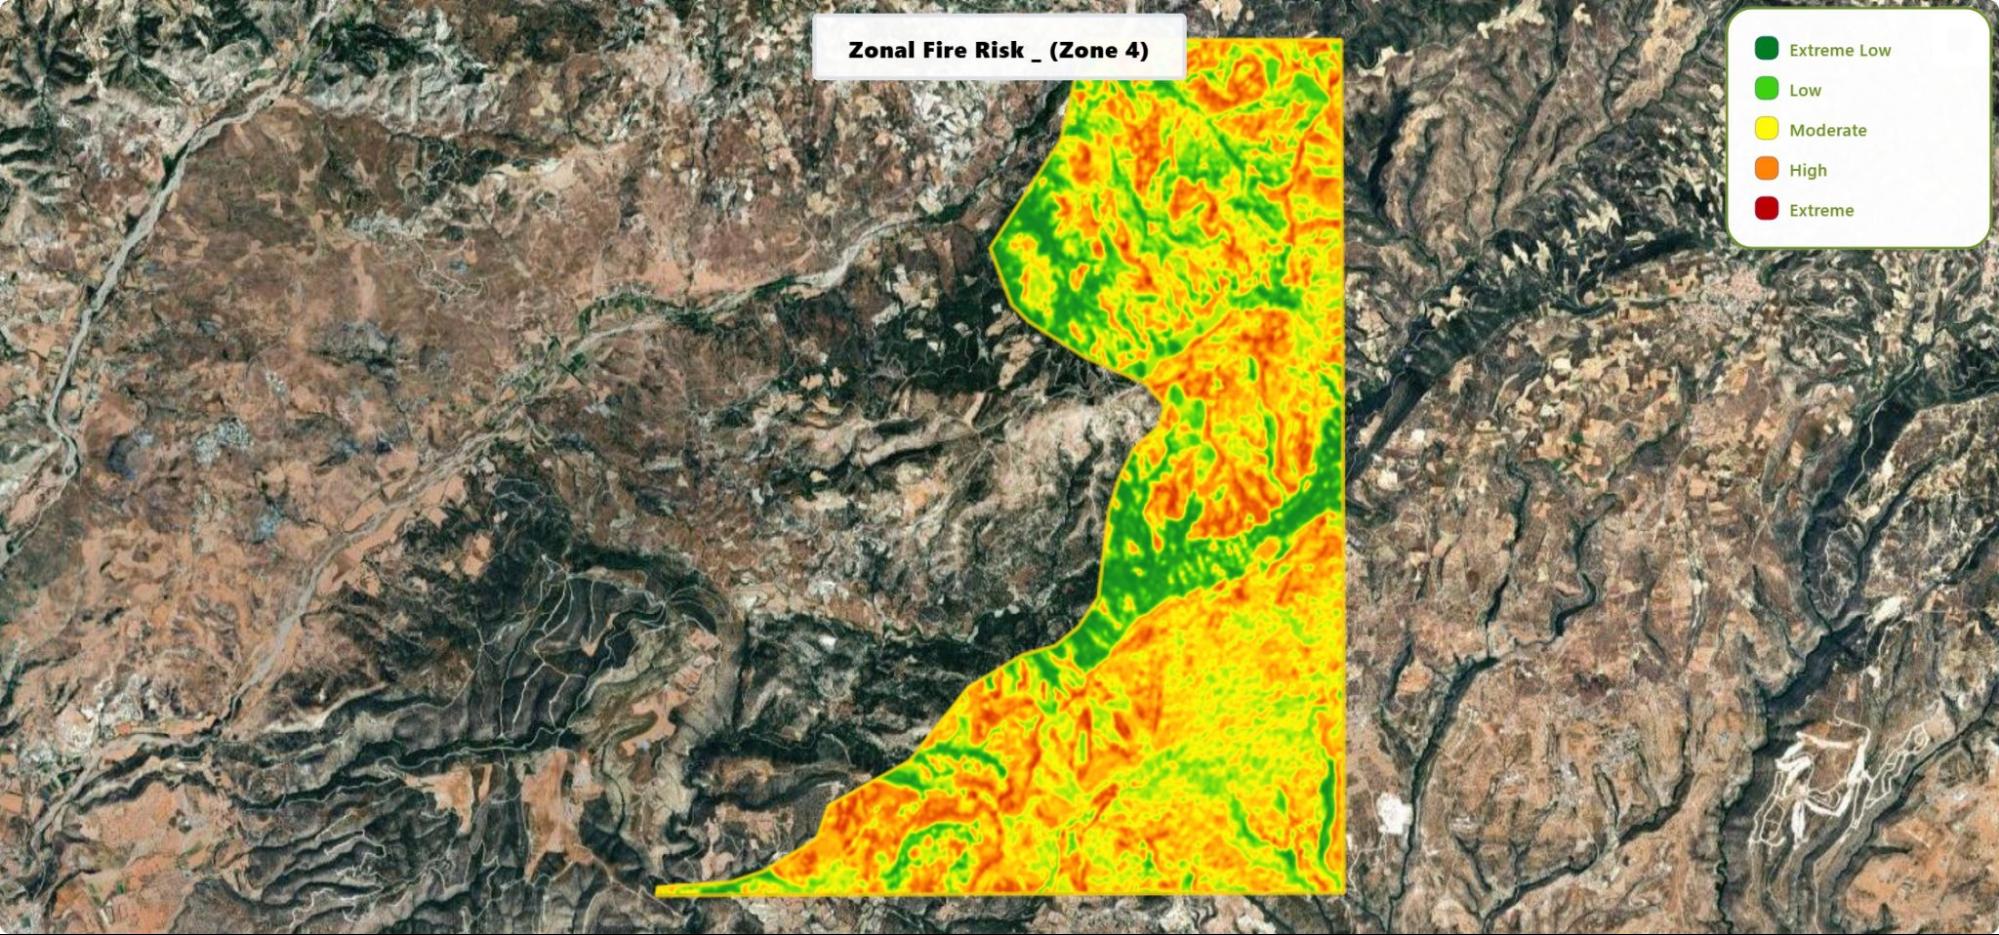
High–extreme risk dominates the southern wedge and mid-eastern slopes; moderate fills much of the remainder; low to extreme-low follows the central valley spine and upper/northern edge pockets.
-
ZONE 5 RISK MAP

Predominantly high–extreme risk across the interior ridges, especially central and south; moderate appears between ridgelines; low to extreme-low forms a narrow eastern edge belt and a few small northern/lowland pockets.
-
ZONE 6 RISK MAP
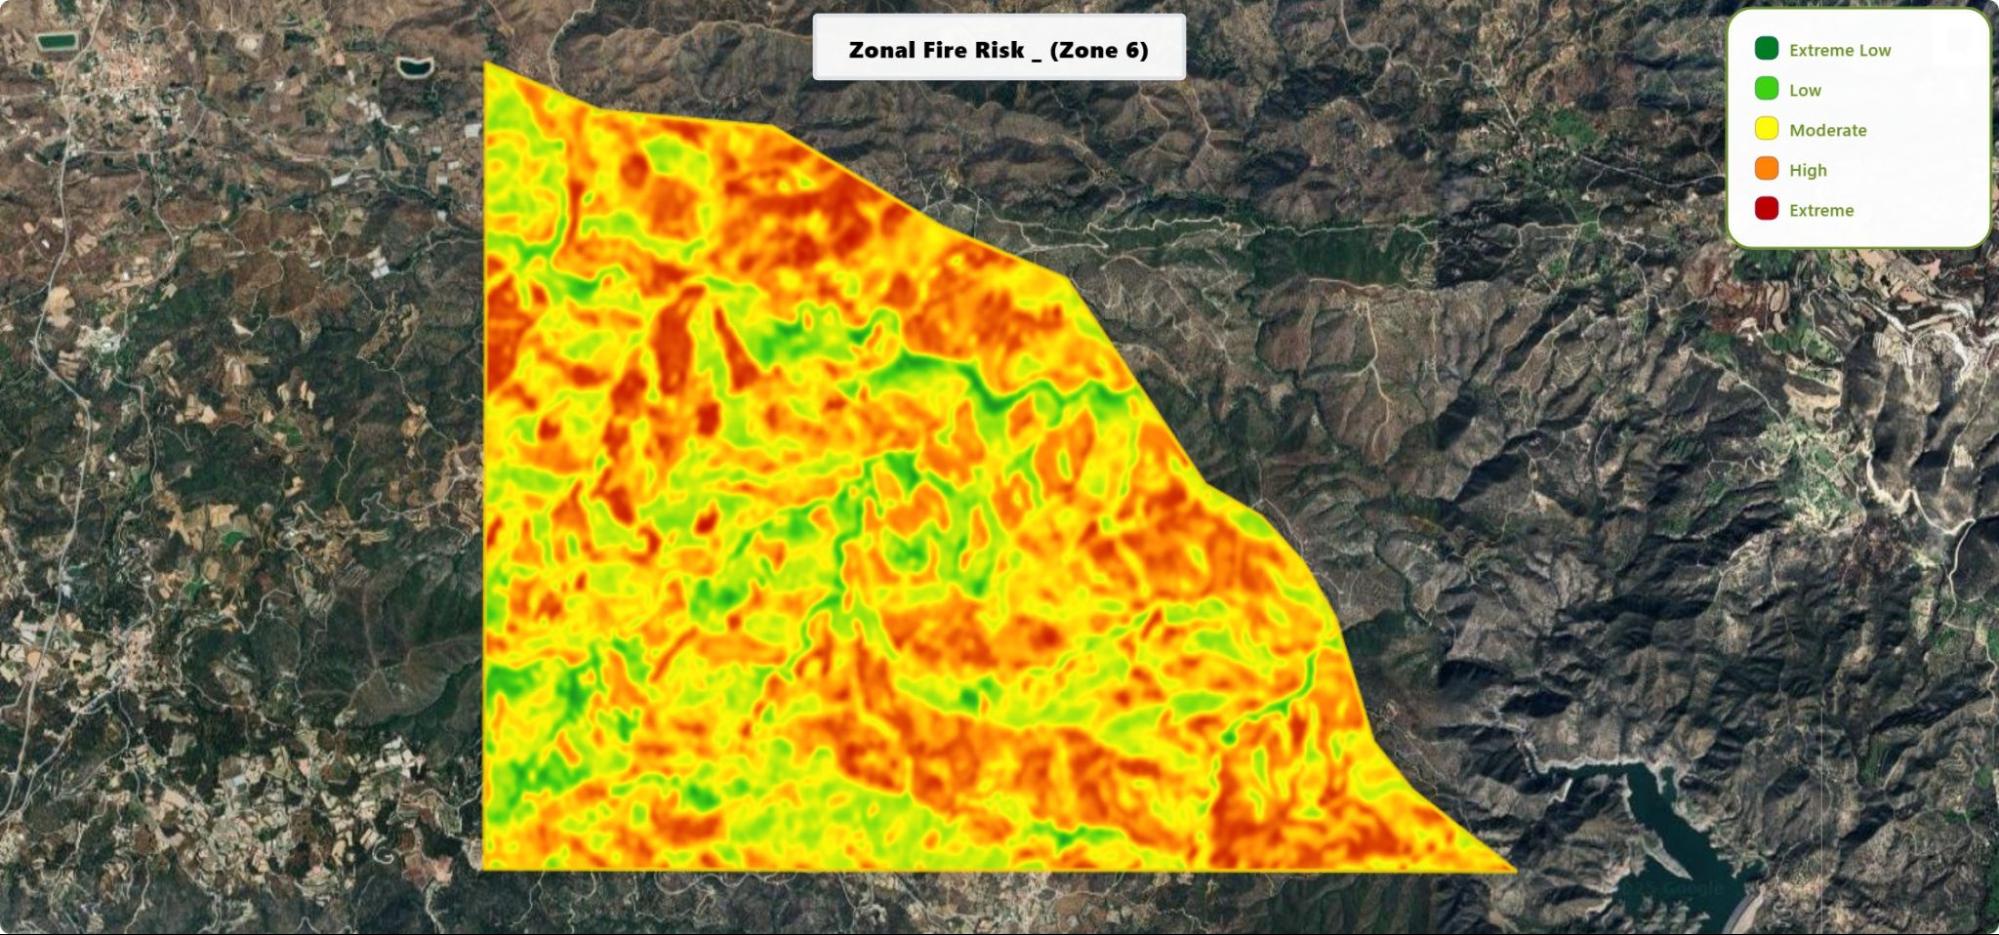
High–extreme risk clusters across the central and southeastern ridges and along the eastern margin; moderate is widespread elsewhere; low to extreme-low appears as scattered corridors, mainly north-central and west-central valleys.
-
ZONE 7 RISK MAP
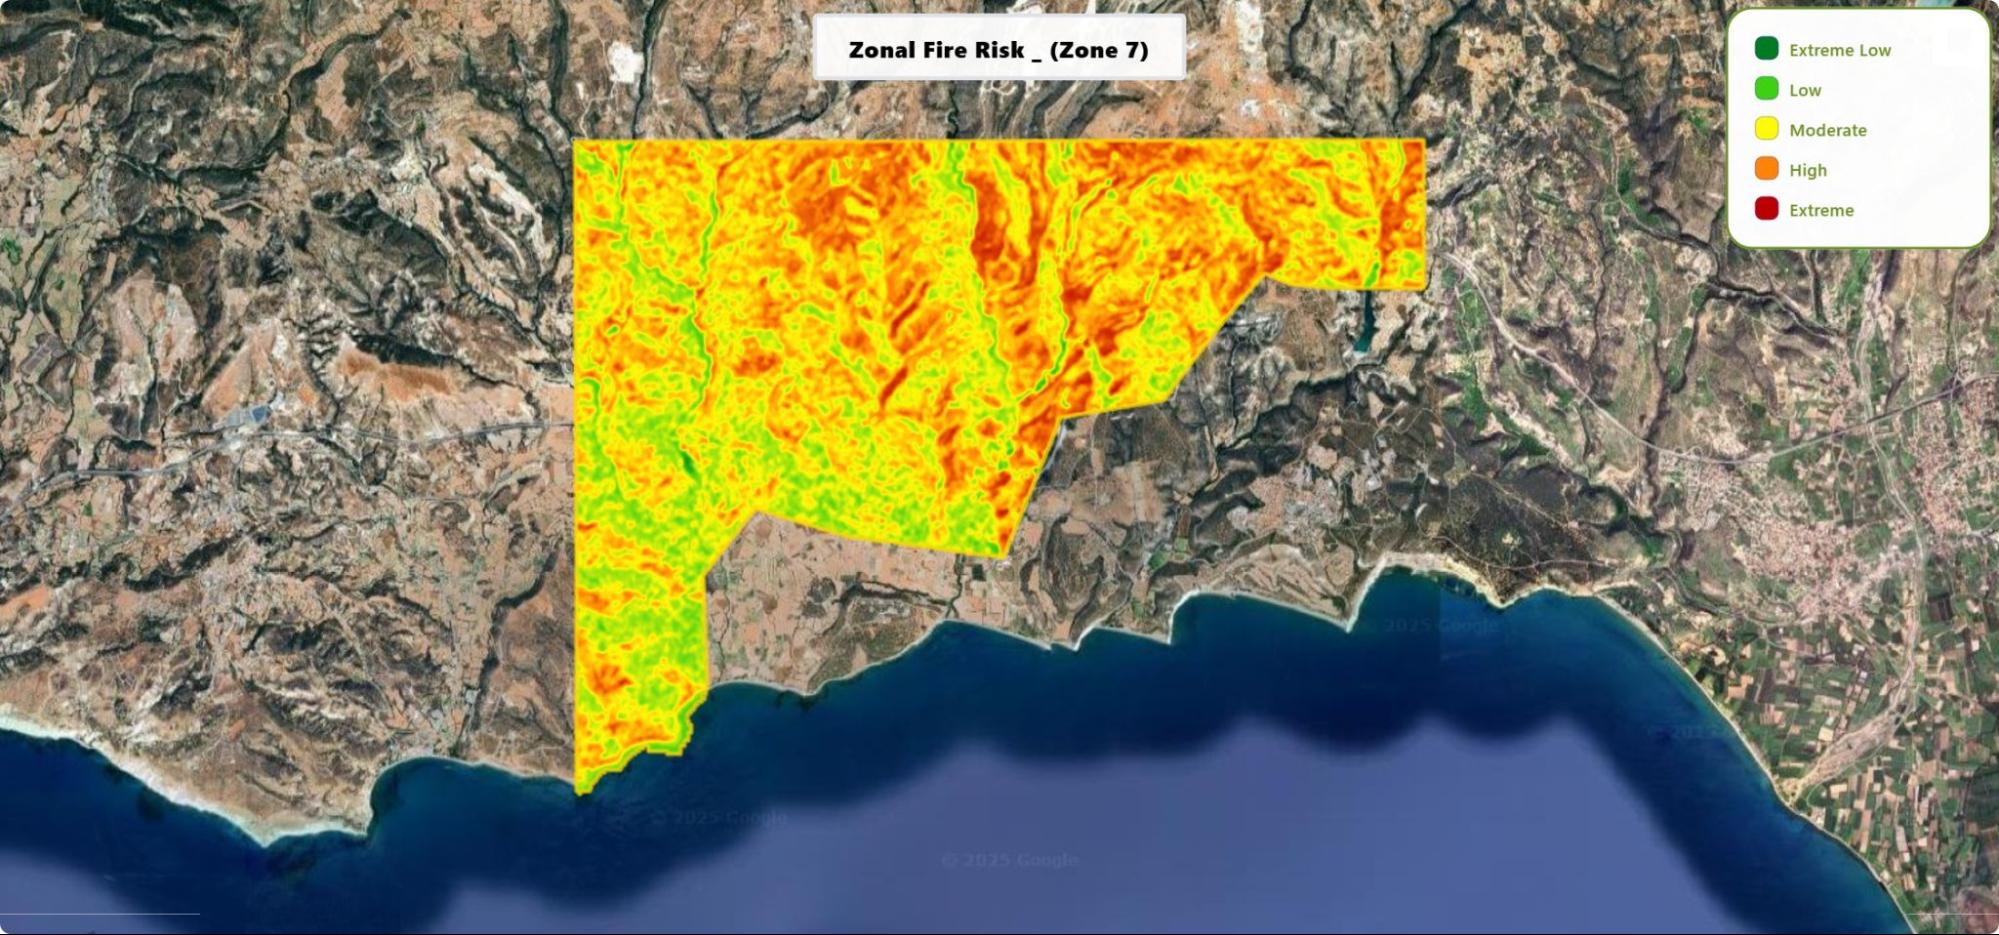
High–extreme risk lines the northern upland belt and eastern ridges; moderate covers much of the interior; low to extreme-low sits on the southern coastal plain and a south-western wedge with thin valley strips elsewhere.
-
ZONE 8 RISK MAP
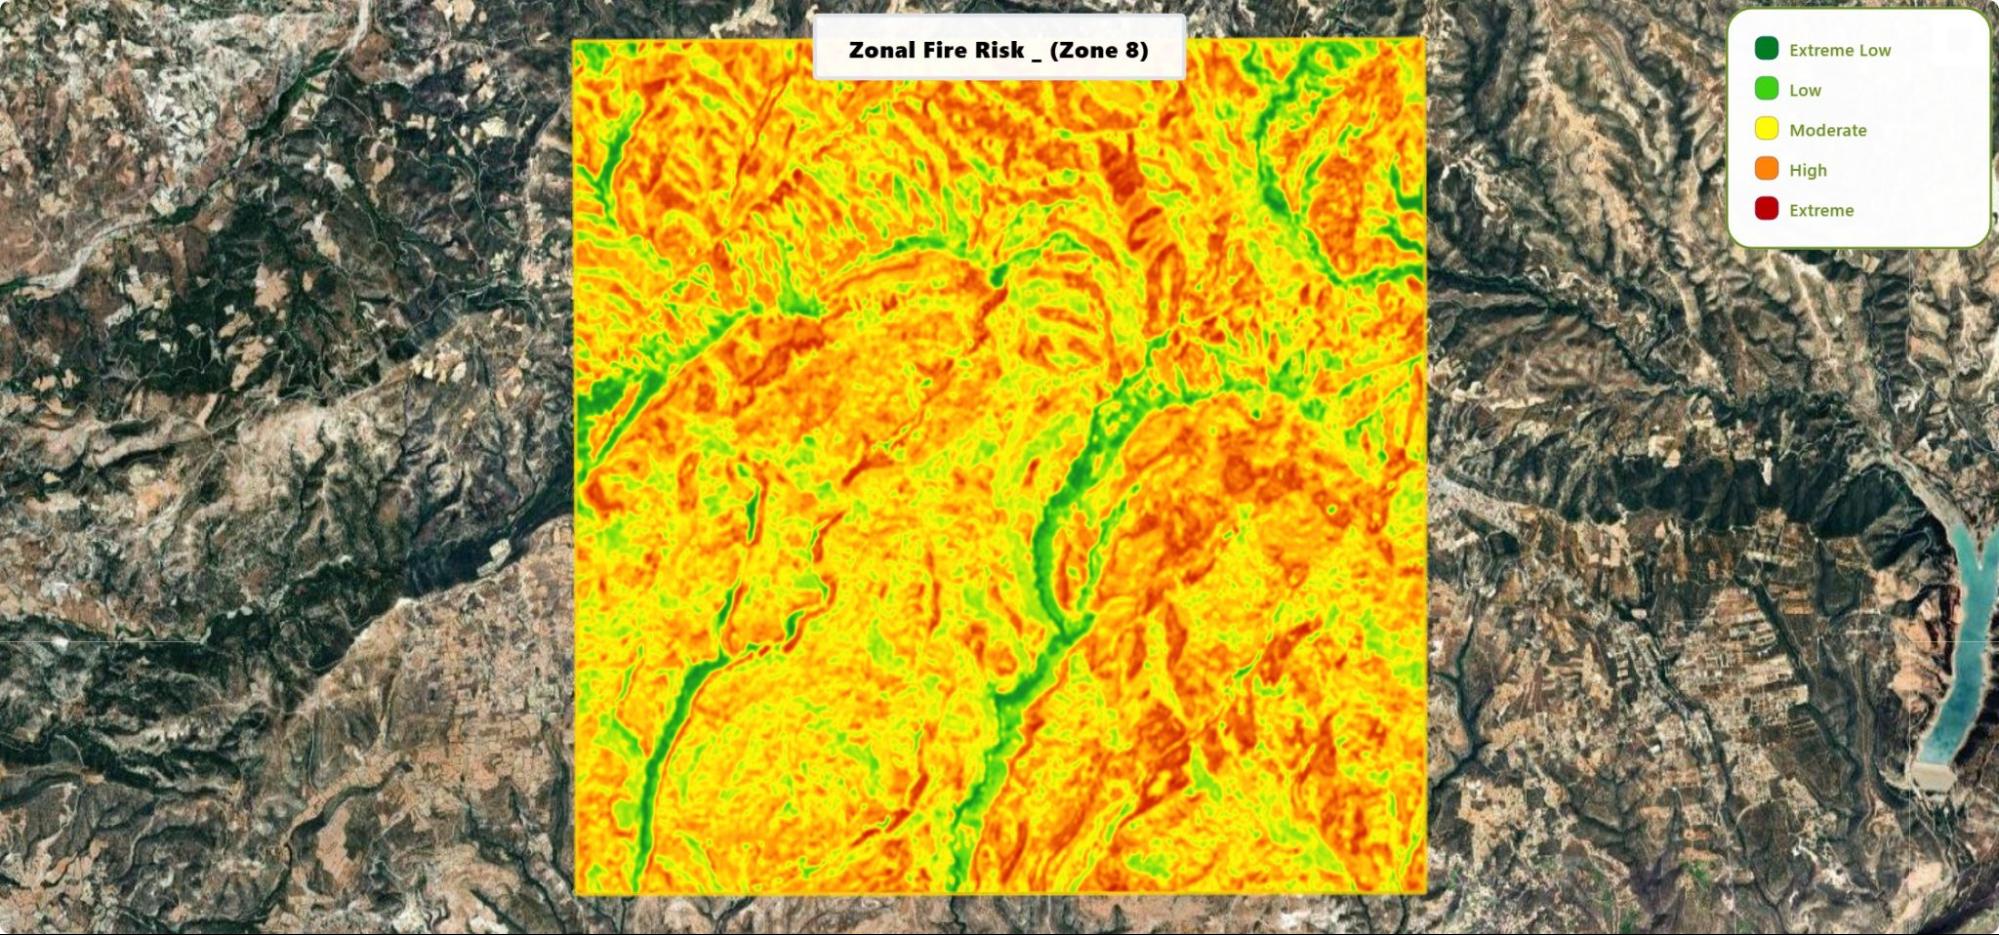
High–extreme risk is widespread over the interior hills; moderate surrounds these; low to extreme-low traces the main valley corridors running north–south and west–east, forming green channels through the zone.
-
ZONE 9 RISK MAP

High–extreme risk dominates the south-western half and scattered central ridges; moderate fills the mid-slopes; low to extreme-low is more common in the northern and eastern sectors, with valley belts extending inward.
-
ZONE 10 RISK MAP

High–extreme risk rings the ridgelines around the central Y-shaped reservoir/valley system (north, east and south slopes); moderate lies between; low to extreme-low occupies the reservoir and its branching valleys.
-
ZONE 11 RISK MAP

High–extreme risk spreads across the interior hills, especially central and western parts; moderate intermixes widely; low to extreme-low forms a continuous narrow coastal strip and a few valley corridors inland.
Limitations
Limitation: Low Resolution Data
One of the biggest limitations in wildfire prediction is the use of low-resolution satellite data.
Low-resolution data means the images are not very clear, and each pixel represents a large area on the ground. Because of this, important details — like small dry patches, narrow fuel corridors, or small vegetation clusters — may be missed. These details are often the early signs of wildfire danger.
High-resolution satellite data removes this problem by giving a clearer, more detailed view of the land.
Popular Satellite Datasets and Their Resolutions
| Satellite / Sensor | Ground Resolution (Size of one pixel on Earth) |
| Sentinel-2 | 10 meters |
| Landsat 8 / 9 | 30 meters |
| MODIS | 250–500 meters |
| WorldView-3 | 0.3 meters |
| PlanetScope | 3–5 meters |
| Google Earth Imagery | 0.5–1 meter (varies by location) |
Difference Between These Satellites
- A small number means a clearer image.
For example, 1 meter is much clearer than 30 meters. - High-resolution satellites like WorldView or Google Earth can see small things such as:
- narrow dry grass strips
- small trees
- small fuel pockets
- footpaths, walls, and small firebreaks
- Lower-resolution satellites like Landsat or MODIS can only see bigger features, such as:
- large forest blocks
- big burned areas
- general vegetation patterns
So, high resolution = more detail.
Low resolution = only big features are visible.

| 30m Resolution
Landsat 8 Surface Reflectance |
10m Resolution
Sentinel-2 Surface Reflectance |
1m Resolution
NAIP aerial imagery |
What Is Resolution
You can think of resolution like the quality of a photo on your mobile:
- A clear and sharp photo shows every detail — leaves, grass, soil cracks.
- A blurry photo only shows big shapes — you can’t see small things.
Satellite resolution works the same way:
- If the resolution is 1 meter, the satellite can see things as small as 1 meter on the ground.
- If the resolution is 30 meters, the smallest thing it can detect is the size of a room or a small house.
Higher resolution means:
- more details
- clearer land features
- A better understanding of what is happening on the ground
How High-Resolution Data Helps Wildfire Risk Prediction
High-resolution data is extremely important in wildfire risk studies because wildfires often start from small, highly flammable areas that low-resolution images cannot detect.
High-resolution data helps to:
a) Identify small fuel pockets
Dry vegetation patches that are only a few meters wide can start and spread fire. High-resolution images show:
- dry grass strips
- small bushes
- dead plant clusters
b) Map hazards more accurately
You can separate:
- dry vs. healthy vegetation
- empty land vs. dense shrubs
- narrow footpaths vs. fire corridors
This leads to a more accurate fire risk map.
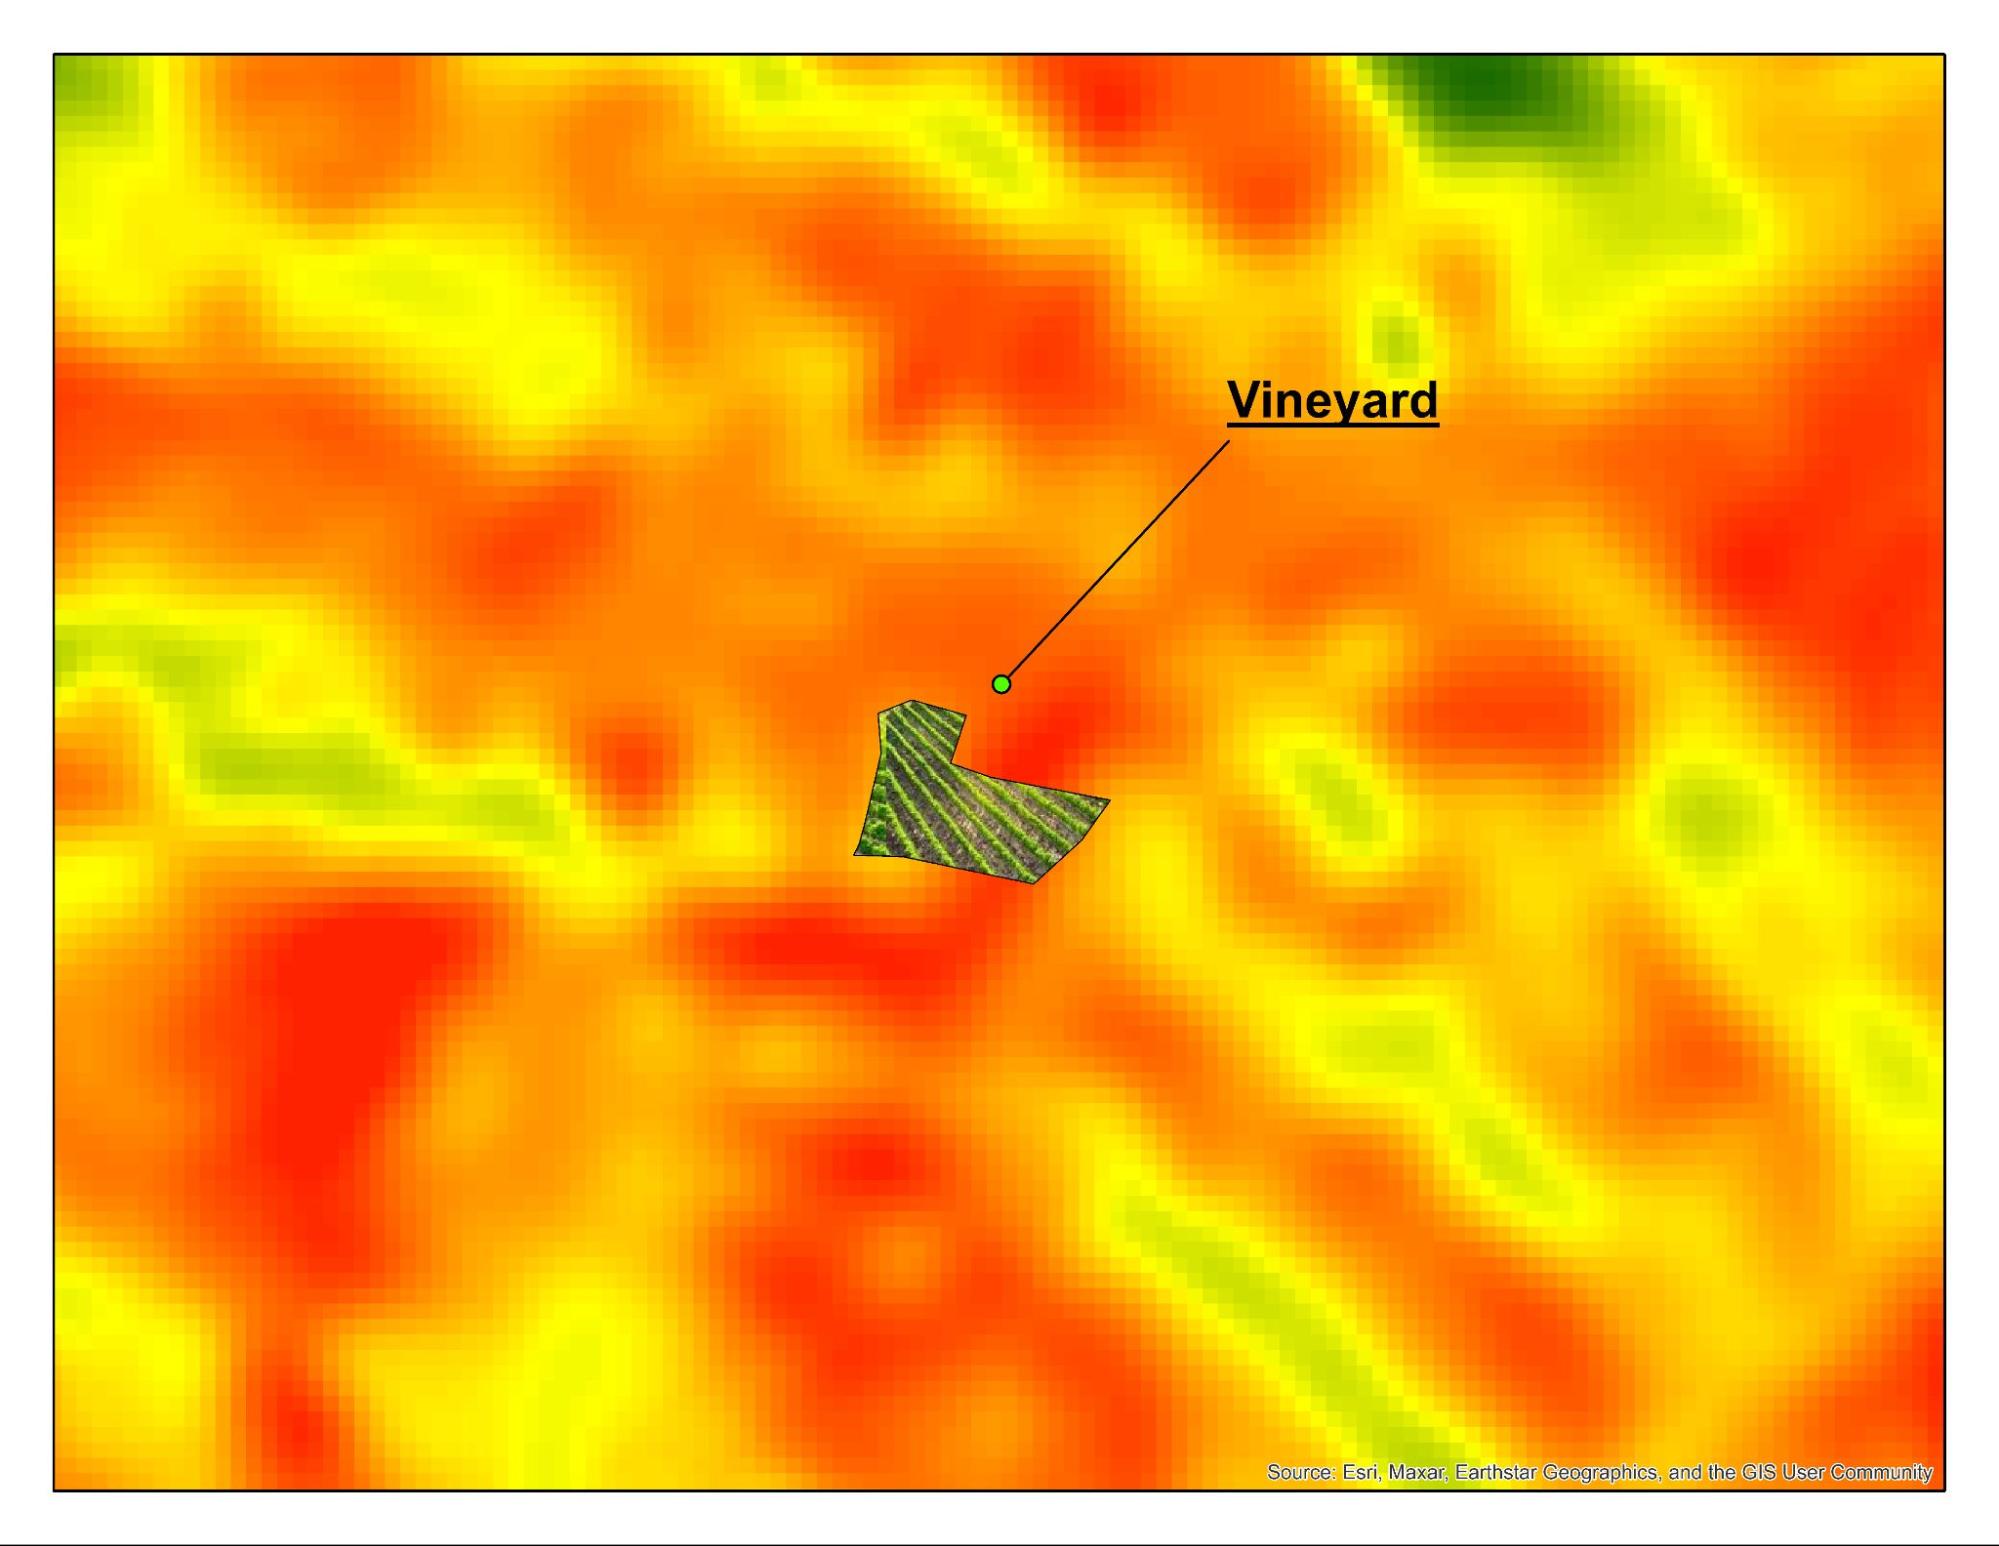
c) Detect fire-prone areas near assets
If you have a vineyard, farm, or house, high-resolution data shows the exact fuel conditions around it, helping you plan treatments and buffer zones.
d) Improve early warning
Early signs like:
- colour change in vegetation
- moisture loss
- small burn scars
are easier to detect in high-resolution images.
e) Support fire-mitigation planning
You can plan:
- where to remove dry vegetation
- where to create firebreaks
- where to install water tanks or fire access routes
- which areas need urgent treatment (Class 1)
This results in a smarter, more effective wildfire prevention plan.
How High Resolution Helps Mitigation Actions
High-resolution data helps experts decide:
- which zones need urgent treatment
- where the fire can travel fastest
- Which areas need fuel removal
- where to create defensible space
With better detail, mitigation becomes more targeted, meaning:
- less cost
- more accuracy
- better protection for farms, vineyards, forests, and houses
Mitigation
Now we have to think about mitigation: how to prepare ourselves to reduce the damage and recover quickly from the wildfire effects.
We will proceed step by step.
- Locate the risk areas
- Analyse the assets that come under the risk area
- Deeply mark the risk classes near the assets
- Mark the areas where you have to remove the fuel load ( which is dry vegetation)
STEP 1. Locate the risk areas
STEP 2. Analyse the assets that come under the risk area
STEP 3. Deeply mark the risk classes near the assets

STEP 4. Mark the areas where you have to remove the fuel load ( which is dry vegetation)

1. Critical Priority Mitigation Zone (Very High Risk)
Objective: Immediate fuel reduction to prevent fire from reaching the asset.
Mitigation Actions:
- Remove all dry vegetation, dead branches, and accumulated leaf litter.
- Create a minimum 10–20 m defensible buffer with zero combustible material.
- Thin dense shrubs and remove ladder fuels that can carry fire upward.
- Prune lower tree branches (up to 2–3 m height) to prevent crown fires.
- Establish mineral soil fire breaks or gravel strips around high-risk clusters.
- Schedule frequent inspections during the peak summer season.
2. High Priority Treatment Zone (High Risk)
Objective: Reduce fuel continuity and slow fire spread toward the vineyard.
Mitigation Actions:
- Selectively remove or space out bushes to break continuous fuel lines.
- Clear dry grass, annual weeds, and half-decomposed organic material.
- Maintain vertical separation: no vegetation should connect ground to tree crowns.
- Maintain horizontal separation: reduce vegetation density by 30–50%.
- Introduce controlled mowing or seasonal fuel load reduction every 3–4 months.
- Install fire-resistant barriers (stone walls, gravel, low-moisture vegetation).
3. Routine Fuel Management Zone (Moderate Risk)
Objective: Maintain low fuel levels and prevent risk from escalating.
Mitigation Actions:
- Regular mowing and trimming of grasses before they dry out.
- Remove scattered dead shrubs and debris.
- Maintain healthy vegetation with adequate moisture where possible.
- Conduct seasonal fuel checks (spring & early summer).
- Keep vehicle access routes clear for emergency interventions.